Summary:
This is a copy of https://github.com/pytorch/pytorch/pull/97152 to make
the landing easier.

This PR implements a two-pass wrapper codegen for the Triton
backend to achieve ahead-of-time compilation. In the first pass, the
regular python wrapper code will be generated, and then the generated
code will be executed to perform Triton compilation and autotuning.
After that, the second pass wrapper codegen will generate C++ wrapper
with proper CUDA API to load and launch Triton-generated CUDA kernels.

Like the AOT mode for the cpp backend, the next step would be to provide
a more complete API for AOT.

Pull Request resolved: https://github.com/pytorch/pytorch/pull/98214
Approved by: https://github.com/eellison
Summary:
`:test_dynamo` has been broken for long time internally in Meta. This PR is to fix the  broken test and re-enable it internally.
- Using the root `pytest.ini` for pytest
- Decouple tests so that one can be disabled with affecting others
- Temporarily disable the test cases that require additional efforts to fix

**OSS CI doesn't provide test code coverage info. Meta internal test infra does. The value of re-enabling these tests internally is not only to collect test coverage info but help fbcode developers to build/test from fbcode.**

Test Plan:
`buck test mode/dev-nosan //caffe2/test:test_dynamo`
https://www.internalfb.com/intern/testinfra/testrun/7318349540623516

Differential Revision: D44325238

Pull Request resolved: https://github.com/pytorch/pytorch/pull/97937
Approved by: https://github.com/ezyang
using the existing deterministic implementation via `index_put` which has a deterministic implementation based on sorting indices.

With the `accumulate` arg in `index_put`, this can work for both scatter and scatter_reduce with sum/mean reduction mode.

Pull Request resolved: https://github.com/pytorch/pytorch/pull/98060
Approved by: https://github.com/mikaylagawarecki
Summary:
Supporting Per Channel quantization in the gradient computation function.

One workaround that I have added here is
Current QNNPACK is not designed to process [transposed weight](https://fb.workplace.com/groups/pytorch.edge.users/permalink/1283737025829921/)
Here we are simply replacing Per Channel to Per Tensor to compute a gradient (Some slow learning curve or WER degradation might be expected - We don't know, nothing is guaranteed)

Test Plan:
You can create your own synthetic model,
FP32 layer -> INT8 layer with Per Channel and see if loss is decreasing

Differential Revision: D43898794

Pull Request resolved: https://github.com/pytorch/pytorch/pull/97475
Approved by: https://github.com/weiwangmeta
Summary:
This diff extends pattern matcher, by adding a few features which allows it to handle split-getitem-cat style patterns.

3 problems I encountered were:

1. In the handler, I only need one Arg() (the one which is the first input to split). None of the other args are relevant to replacement graph.  So, we add a new Ignored() pattern to have ignored args

2. The pattern matching was visiting the split node again and again during the DFS. By propogating the patterns with _users>1 or Any into the child MatchContext, we avoid this problem.

3. To avoid the unbundling issue, I switched to using KeywordArg() instead of Arg() - as for this pattern, we need a flat list of Arg() in the end

Example pattern: https://www.internalfb.com/intern/anp/view/?id=3325856

```
pass_patterns.append(defaultdict(list))

register_replacement_pattern(
    CallFunction(
        aten.cat,
            ListOf( CallFunction(operator.getitem, CallFunction(aten.split_with_sizes, KeywordArg("input_"), Ignored(), Ignored(), _users=Any),
                                                   Ignored()
                                                   ),),
        Ignored()
    ),
    pass_number=3
)
def split_cat_replace(input_):
    return input_
```

Test Plan: https://www.internalfb.com/intern/anp/view/?kernel=default&id=3317105

Reviewed By: jansel

Differential Revision: D44282499

Pull Request resolved: https://github.com/pytorch/pytorch/pull/97726
Approved by: https://github.com/jansel
This patch is part of half float performance optimization on CPU:
* add specification for dtype `Half` in `Vectorized<>` under both avx256 and avx512.
* add specification for dtype `Half` in functional utils, e.g. `vec::map_reduce<>()`, which uses float32 as accumulate type.

Also add a helper struct `vec_hold_type<scalar_t>`, since Vectorized<Half>::value_type is pointing to its underlying storage type which is `uint16_t`, leading to error if the kernel uses `Vec::value_type`.

Half uses the same logic as BFloat16 in the Vectorized<>, each half vector is mapped to 2x float vectors for computation.

Notice that this patch modified the cmake files by adding **-mf16c** on AVX2 build, from https://gcc.gnu.org/onlinedocs/gcc/x86-Options.html, we can see that all the hardware platforms that support **avx2** already have **f16c**

Pull Request resolved: https://github.com/pytorch/pytorch/pull/96076
Approved by: https://github.com/malfet
I notice that we are running some slow tests for CPU and `sm86` on pull and trunk.  They take much longer to run than other shards (1.5x to 2x longer).  I propose that we move them to periodic instead. Thoughts?

The correlation between them are:

* `linux-bionic-cuda11.7-py3.10-gcc7-sm86 / test (slow)` and `linux-bionic-cuda11.7-py3.10-gcc7-sm86 / test (default)` is 0.93
* `linux-bionic-py3.8-clang9-slow / test (slow)` and `linux-bionic-py3.8-clang9 / test (default)` is 0.98

<!--
copilot:summary
-->
### <samp>🤖 Generated by Copilot at db56750</samp>

This pull request updates the `.github/workflows` files to optimize the testing workflows for PyTorch. It adds new periodic workflows for more platforms and configurations, and removes some redundant or slow workflows from the pull and trunk workflows.
Pull Request resolved: https://github.com/pytorch/pytorch/pull/98040
Approved by: https://github.com/malfet
Remove `CppTile2DTailKernel` and `CppTile2DKernelChecker` and reuse `CppVecKernel` and `CppVecKernelChecker` for them. Add vectorization with fallback for load/store in CppVecKernel for the non-contiguous load/store needed by `CppTile2DTailKernel`.

This PR also adds a functional support for transposed copy of bfloat16 data types. Better performance requires vectorized intrinsics implemented for at::vec::transpose_mxn. cc @soumith @voznesenskym @penguinwu @anijain2305 @EikanWang @Guobing-Chen @XiaobingSuper @zhuhaozhe @blzheng @Xia-Weiwen @wenzhe-nrv @jiayisunx @peterbell10 @desertfire

Pull Request resolved: https://github.com/pytorch/pytorch/pull/97626
Approved by: https://github.com/jansel
When copying data from pointers, only lowest bytes are copied. On little endian systems they are located at the beginning of pointer. On big endian systems they are located at the end of pointer.

This change fixes TestTensorExprPyBind::test_dynamic_shape and TestTensorExprPyBind::test_dynamic_shape_2d tests from test/test_tensorexpr_pybind.py on big endian systems.

Pull Request resolved: https://github.com/pytorch/pytorch/pull/96951
Approved by: https://github.com/ezyang, https://github.com/EikanWang
### Description
This PR is to update ideep submodule for the following two aspects:
1. At inductor side, we are supporting dynamic shape path for packed linear, which we hopes the packed weight of linear doesn't depend on the input shapes and still can get a better a performance using a packed weight got from a dummy input shapes. However the current ideep has a accuracy issue for this case. This updating will fix the issue.
2. Add an extra arg is_channels_last for deconv to notify ideep whether to go channels last or not because the memory format checks of ideep (e.g. is_nhwc(), is_ndhwc()) is not 100% identical to suggest_memory_format() from pytorch.
### Performance Benchmark
Use TorchBench test in ICX with 40 cores
Intel OpenMP & tcmalloc were preloaded
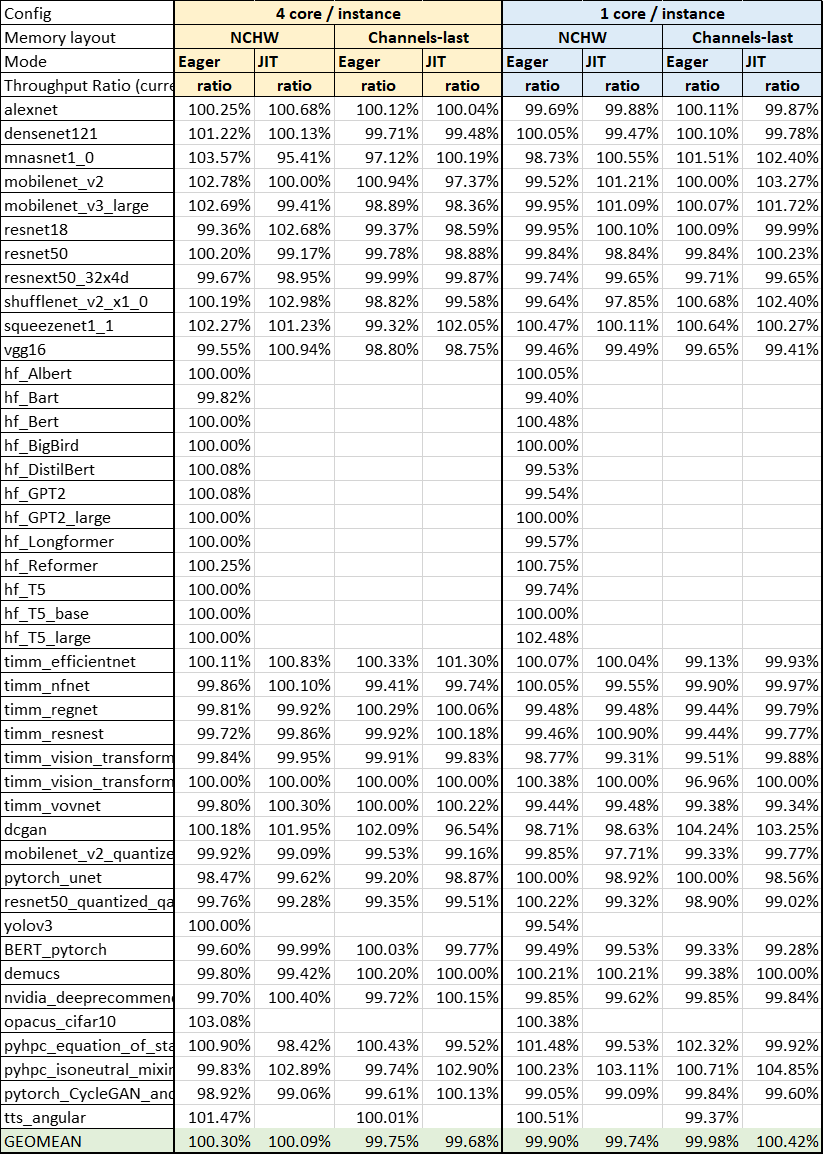
Pull Request resolved: https://github.com/pytorch/pytorch/pull/97430
Approved by: https://github.com/jgong5
Following metrics should be helpful:
- percent of time GPU is busy
- percent of time various category of kernels (e.g. pointwise/reduction triton kernel) takes
- percent of time each individual kernel takes compared to total wall time of the benchmark

This PR add those.

Example result from hf_Bert infernece graph:

```
  == triton_pointwise category kernels ==
Kernel                            Self CUDA TIME (ms)  Count    Percent
------------------------------  ---------------------  -------  ---------
triton_poi_fused_gelu_6_0d1d                  0.48154  12.0     5.52%
triton_poi_fused_clone_1_0d1d2                0.29011  24.0     3.33%
triton_poi_fused_clone_2_0d1d2                0.17417  12.0     2.00%
triton_poi_fused_clone_4_0d1d2                0.10797  12.0     1.24%
Total                                         1.05379           12.08%

  == triton_persistent_reduction category kernels ==
Kernel                            Self CUDA TIME (ms)  Count    Percent
------------------------------  ---------------------  -------  ---------
triton_per_fused__softmax__to_                0.97188  12.0     11.14%
triton_per_fused_add_native_la                0.37401  24.0     4.29%
triton_per_fused_gelu_native_l                0.02     1.0      0.23%
triton_per_fused_add_embedding                0.01718  1.0      0.20%
Total                                         1.38307           15.86%

  == unknown category kernels ==
Kernel                            Self CUDA TIME (ms)  Count    Percent
------------------------------  ---------------------  -------  ---------
ampere_fp16_s16816gemm_fp16_12                2.24514  24.0     25.74%
ampere_fp16_s16816gemm_fp16_25                1.39796  49.0     16.03%
void cutlass::Kernel<cutlass_8                1.36093  1.0      15.61%
ampere_fp16_s16816gemm_fp16_64                0.74591  12.0     8.55%
ampere_fp16_s16816gemm_fp16_12                0.61989  12.0     7.11%
Memset (Device)                               0.024    12.0     0.28%
void at::native::(anonymous na                0.01543  2.03     0.18%
void at::native::vectorized_el                0.00011  0.03     0.00%
Total                                         6.40937           73.49%

Percent of time when GPU is busy: 101.44%
```

Note: the output shows total time GPU is busy is larger than total wall time. We measure total wall time disabling profiling while measure GPU time enabling profiling, that may distort the measurement a bit? But I assume the effect is not too large assuming the profiler mostly increase CPU time (rather than GPU).

## interesting usages
1. I pick a model that cudagraphs improve perf significantly like densenet121 and run the tool on it's forward graph. It's no surprise that quite a lot of time GPU is idle:
```
(Forward graph) Percent of time when GPU is busy: 32.69%
Total wall time 17.307 ms
```

Its backward graph has less percent of GPU idle time, but it's still high:
```
(Backward graph) Percent of time when GPU is busy: 46.70%
Total wall time 17.422 ms
```

2. I profile a subset of torchbench models and plot a table to show the percent of execution time for pointwise/reduction/persistent_reduction/unknown_category . Since I plan to explore using coordinate descent tuner to improve reduction, those models with high percent of time spending on reduction should be good caididates (e.g. resnet50, mobilenet_v2 ).

NOTE: a same model appears twice. The first rows is for the fwd graph and the second for the bwd graph. We profile different graphs for a model separately.

```
benchmark_name           pointwise_percent    reduction_percent    persistent_reduction_percent    unknown_category_percent    GPU_busy_percent    wall_time_ms
-----------------------  -------------------  -------------------  ------------------------------  --------------------------  ------------------  --------------
resnet18                 19.73%               7.86%                4.81%                           41.25%                      73.65%              2.549ms
resnet18                 18.59%               7.13%                3.35%                           67.35%                      96.41%              3.467ms
resnet50                 29.57%               22.13%               2.07%                           51.68%                      105.46%             6.834ms
resnet50                 26.42%               15.27%               0.94%                           59.68%                      102.31%             13.346ms
vgg16                    26.23%               0.00%                0.00%                           74.20%                      100.43%             18.212ms
vgg16                    15.63%               5.61%                0.10%                           79.42%                      100.75%             33.485ms
BERT_pytorch             28.62%               4.82%                14.88%                          33.32%                      81.64%              7.162ms
BERT_pytorch             14.43%               13.41%               18.19%                          49.24%                      95.27%              10.395ms
densenet121              11.89%               2.14%                3.86%                           16.36%                      34.25%              16.531ms
densenet121              10.37%               2.06%                4.09%                           31.46%                      47.98%              16.934ms
hf_Bert                  23.94%               0.00%                29.88%                          46.09%                      99.90%              7.766ms
hf_Bert                  11.65%               10.54%               20.26%                          61.66%                      104.11%             11.892ms
nvidia_deeprecommender   42.92%               0.00%                0.00%                           56.75%                      99.67%              3.476ms
nvidia_deeprecommender   31.36%               3.44%                0.46%                           65.20%                      100.45%             3.872ms
alexnet                  30.99%               0.00%                0.00%                           69.16%                      100.14%             3.169ms
alexnet                  24.41%               4.83%                0.17%                           71.09%                      100.50%             4.709ms
mobilenet_v2             29.21%               27.79%               2.49%                           44.00%                      103.49%             10.160ms
mobilenet_v2             17.50%               15.05%               1.06%                           69.68%                      103.29%             20.715ms
resnext50_32x4d          18.96%               9.28%                2.31%                           28.79%                      59.33%              5.899ms
resnext50_32x4d          18.48%               11.01%               1.86%                           53.80%                      85.14%              7.167ms
mnasnet1_0               19.07%               14.52%               3.01%                           35.43%                      72.03%              6.028ms
mnasnet1_0               14.17%               12.00%               1.87%                           67.56%                      95.60%              9.225ms
squeezenet1_1            38.56%               0.00%                1.77%                           56.21%                      96.53%              2.221ms
squeezenet1_1            21.26%               7.57%                1.05%                           67.30%                      97.18%              4.942ms
timm_vision_transformer  17.05%               0.00%                18.80%                          65.79%                      101.64%             9.608ms
timm_vision_transformer  9.31%                9.07%                10.32%                          73.25%                      101.96%             16.814ms
```

## how to use
`python {compiled_module_wrapper.py} -p`

Pull Request resolved: https://github.com/pytorch/pytorch/pull/97723
Approved by: https://github.com/jansel
We have noticed that on BERT_pytorch in torchbenchmark majority of time is spent in running GEMM in aten:addmm. At the moment this calls into BLAS routine, but on AArch64 it will be faster if it calls into mkldnn_matmul. Performance wise compared to build with OpenBLAS it runs faster 1.2x faster on 16 cores with batch size of 8 on Graviton3, while if fast math mode (mkldnn_matmul exposes through oneDNN and Arm Compute Library option to run GEMM with FP32 inputs using BBF16 operations) is enabled then it is 2.3x

Fixes #ISSUE_NUMBER

Pull Request resolved: https://github.com/pytorch/pytorch/pull/91763
Approved by: https://github.com/jgong5, https://github.com/ngimel, https://github.com/malfet