mirror of
https://github.com/zebrajr/pytorch.git
synced 2025-12-07 12:21:27 +01:00
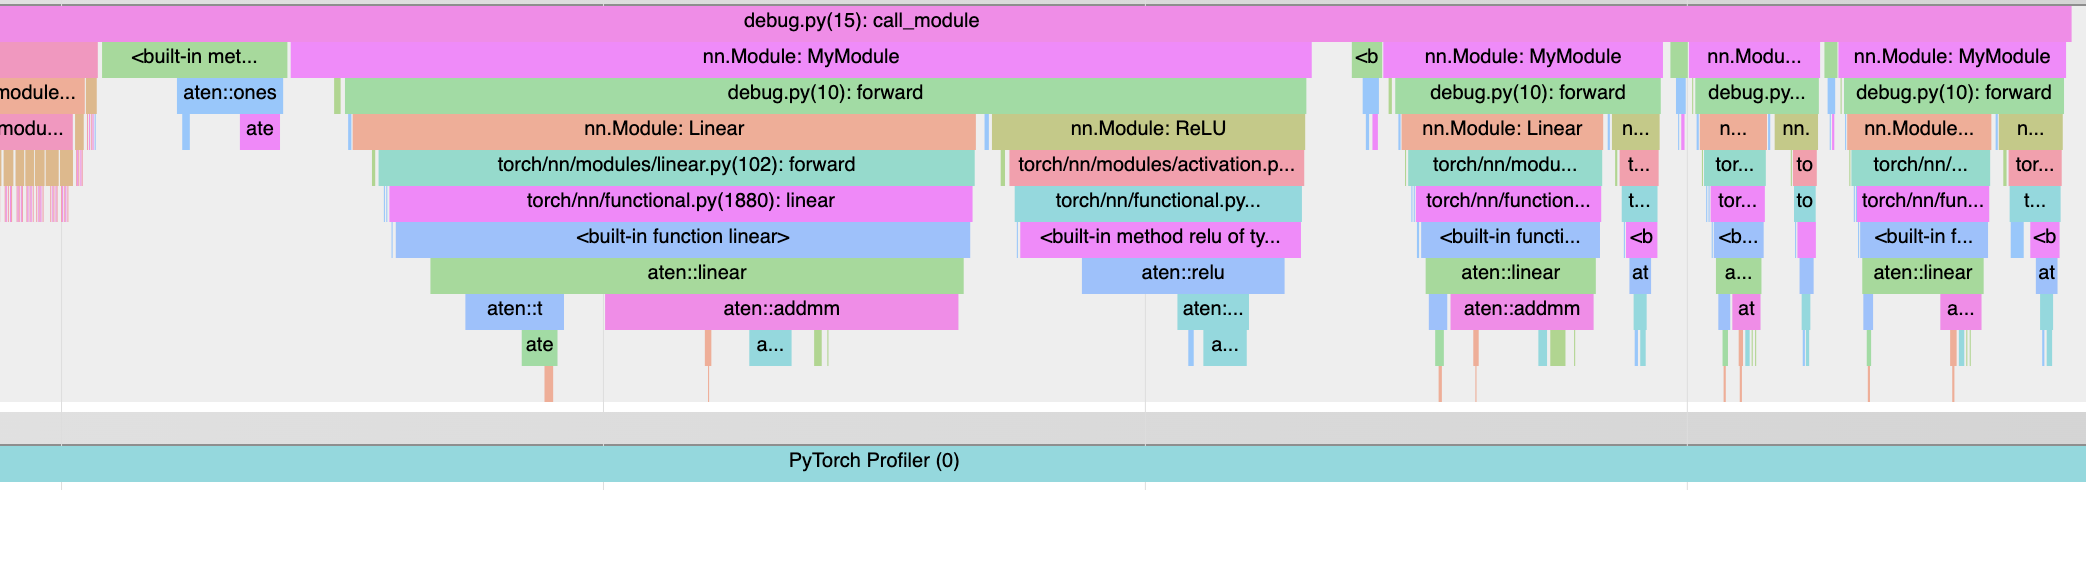
Summary:
This PR instruments the CPython interpreter and integrates the resulting trace into the PyTorch profiler.

The python tracing logic works by enabling `PyEval_SetProfile`, and then logging the minimal information to track every time python calls or returns from a function. A great deal of care has gone into keeping this process very lightweight; the `RawEvent` struct is only two words and doesn't do anything fancy. When a python function is called, we have to do extra work. If the call is to `nn.Module.__call__`, we simply incref to extend the life of the module. Otherwise we check if we have seen the function before, and if not go through the (somewhat expensive) task of saving the strings which we then cache.

To actually get a useful timeline, we have to replay the events to determine the state of the python stack at any given point. A second round of stack replay is needed to figure out what the last python function was for each torch op so we can reconstruct the correct python stack. All of this is done during post processing, so while we want to be reasonably performant it is no longer imperative to shave every last bit.

I still need to do a bit of refinement (particularly where the tracer interfaces with the profiler), but this should give a good sense of the general structure.

Pull Request resolved: https://github.com/pytorch/pytorch/pull/67407

Test Plan:
```
import torch

class MyModule(torch.nn.Module):
    def __init__(self):
        super().__init__()
        self.linear = torch.nn.Linear(2, 2)
        self.relu = torch.nn.ReLU()

    def forward(self, x):
        x = self.linear(x)
        return self.relu(x)

def call_module():
    m = MyModule()
    for _ in range(4):
        m(torch.ones((2, 2)))

def top_level_fn():
    with torch.profiler.profile(with_stack=True) as p:
        call_module()

    p.export_chrome_trace("test_trace.json")

top_level_fn()
```
<img width="1043" alt="Screen Shot 2021-10-27 at 6 43 18 PM" src="https://user-images.githubusercontent.com/13089297/139171803-f95e70f3-24aa-45e6-9d4b-6d437a3f108d.png">

PS: I've tried to comment liberally, particularly around some of the more magical parts. However I do plan on doing another linting and commenting pass. Hopefully it's not too bad right now.

Reviewed By: gdankel, chaekit

Differential Revision: D32178667

Pulled By: robieta

fbshipit-source-id: 118547104a7d887e830f17b94d3a29ee4f8c482f
711 lines
26 KiB
C++
711 lines
26 KiB
C++
#include <torch/csrc/autograd/profiler_python.h>
|
|
|
|
#include <iostream>
|
|
#include <limits>
|
|
#include <memory>
|
|
|
|
#if CAFFE2_HAVE_RE2
|
|
#include <re2/re2.h>
|
|
#else
|
|
#include <regex>
|
|
#endif
|
|
|
|
#include <string>
|
|
#include <utility>
|
|
#include <vector>
|
|
|
|
#include <Python.h>
|
|
#include <frameobject.h>
|
|
|
|
#include <c10/macros/Macros.h>
|
|
#include <c10/util/flat_hash_map.h>
|
|
#include <torch/csrc/autograd/profiler_kineto.h>
|
|
#include <torch/csrc/utils/python_strings.h>
|
|
#include <torch/csrc/utils/pybind.h>
|
|
|
|
namespace py = pybind11;
|
|
|
|
|
|
namespace torch { namespace autograd { namespace profiler { namespace python_tracer {
|
|
namespace {
|
|
|
|
// ============================================================================
|
|
// == Core data types =========================================================
|
|
// ============================================================================
|
|
|
|
// PyObject that allows different threads to record events without colliding.
|
|
// It is passed as the second argument when enabling tracing via
|
|
// `PyEval_SetProfile`.
|
|
struct TraceContext {
|
|
PyObject_HEAD
|
|
|
|
// It is wasteful to store an entire PyThreadState* in RawEvent. So
|
|
// instead, we map thread ids down to a compact space that we can store in
|
|
// a single byte.
|
|
uint8_t thread_id_;
|
|
PyThreadState* thread_state_;
|
|
|
|
// Likewise, int64_t is more precision than we need. By tracking when the
|
|
// profiler starts we can store "time since profile begin" which can fit
|
|
// into less space.
|
|
int64_t initial_us_;
|
|
|
|
// TODO:
|
|
// Wall time is actually fairly expensive to compute. Empirically, it
|
|
// takes ~600 ns to call `now()`. This puts a hard lower bound on the
|
|
// overhead of the tracer. If we collected wall time less frequently, and
|
|
// used TSC (e.g. through __rdtsc) to interpolate it should be possible
|
|
// to reduce time spent on timestamps while retaining the same level of
|
|
// accuracy.
|
|
};
|
|
|
|
// CPython boilerplate to define `TraceContext` as a proper python object.
|
|
static PyTypeObject TraceContextType = {
|
|
PyVarObject_HEAD_INIT(nullptr, 0)
|
|
"TraceContext", /* tp_name */
|
|
sizeof(TraceContext), /* tp_basicsize */
|
|
0, /* tp_itemsize */
|
|
nullptr, /* tp_dealloc */
|
|
0, /* tp_vectorcall_offset */ // NOLINT: modernize-use-nullptr
|
|
nullptr, /* tp_getattr */
|
|
nullptr, /* tp_setattr */
|
|
nullptr, /* tp_reserved */
|
|
nullptr, /* tp_repr */
|
|
nullptr, /* tp_as_number */
|
|
nullptr, /* tp_as_sequence */
|
|
nullptr, /* tp_as_mapping */
|
|
nullptr, /* tp_hash */
|
|
nullptr, /* tp_call */
|
|
nullptr, /* tp_str */
|
|
nullptr, /* tp_getattro */
|
|
nullptr, /* tp_setattro */
|
|
nullptr, /* tp_as_buffer */
|
|
Py_TPFLAGS_DEFAULT, /* tp_flags */
|
|
"Python tracer TLS", /* tp_doc */
|
|
nullptr, /* tp_traverse */
|
|
nullptr, /* tp_clear */
|
|
nullptr, /* tp_richcompare */
|
|
0, /* tp_weaklistoffset */
|
|
nullptr, /* tp_iter */
|
|
nullptr, /* tp_iternext */
|
|
nullptr, /* tp_methods */
|
|
nullptr, /* tp_members */
|
|
nullptr, /* tp_getset */
|
|
nullptr, /* tp_base */
|
|
nullptr, /* tp_dict */
|
|
nullptr, /* tp_descr_get */
|
|
nullptr, /* tp_descr_set */
|
|
0, /* tp_dictoffset */
|
|
nullptr, /* tp_init */
|
|
nullptr, /* tp_alloc */
|
|
PyType_GenericNew, /* tp_new */
|
|
nullptr /* tp_free */
|
|
};
|
|
|
|
// CPython has a more expressive set of events for tracing / profiling:
|
|
// https://github.com/python/cpython/blob/f291404a802d6a1bc50f817c7a26ff3ac9a199ff/Include/cpython/pystate.h#L22-L29
|
|
// As an implementation detail they are defined as 0-7, however we don't want
|
|
// to rely on that while bit packing. Furthermore, the CPython descriptions
|
|
// are finer granularity than we're interested in. We do not need to
|
|
// differentiate between a normal return and an exception (both act as a pop in
|
|
// our replay stack), and we are not interested in `PyTrace_LINE` or
|
|
// `PyTrace_OPCODE`. To simplify things we store our own enum when tracefunc is
|
|
// called, and then use for all subsequent processing.
|
|
enum TraceTag {
|
|
kPy_Call = 0,
|
|
kPy_Return,
|
|
kC_Call,
|
|
kC_Return
|
|
};
|
|
|
|
// When we are tracing a Python program, the general procedure is to record
|
|
// every time we enter or exit a function and later replay these events during
|
|
// post processing. Thus, during the profiling phase we want to do the MINIMAL
|
|
// amount of work to capture all of the information that we need; otherwise we
|
|
// will distort the profile. (While we don't wish to be terribly inefficient
|
|
// during post processing, we are willing to do extra fixup work in post if it
|
|
// reduces overhead in the profiling phase.)
|
|
//
|
|
// To that end, `RawEvent` (which logs calls and returns) is bitpacked to
|
|
// reduce data stored and fit more events on a cache line. The following
|
|
// techniques are used:
|
|
//
|
|
// 1) Storing `tag_` as a uint8_t rather than a TraceTag.
|
|
// The size of an enum, surprisingly, is not the amount of space needed
|
|
// to store all the fields, but rather *at least* that size.
|
|
// (`sizeof(TraceTag) == 2` on my system, for example.)
|
|
//
|
|
// 2) Storing thread id rather than the full PyThreadState*.
|
|
//
|
|
// 3) Storing f_lasti as a uint16_t rather than a full int.
|
|
// In practice this is plenty. It is also less dangerous than it might
|
|
// initially seem; when we call the CPython API (`PyCode_Addr2Line`) we
|
|
// use the full int `f_lasti`. The truncation in the stored event only
|
|
// affects the cache key when we replay the stack. While this could result
|
|
// in cache misses (and unknown names) in corner cases, it has the
|
|
// significant benefit of letting us skip the full line number calculation
|
|
// after the first call to a function.
|
|
//
|
|
// 4) Storing time relative to the start of profiling.
|
|
// In general profiling is short lived. Storing an entire int64_t just to
|
|
// record that a handful of microseconds have passed is not a good use of
|
|
// bits. So instead, we record the time since profiling began. We can
|
|
// fit over an hour into a uint32_t which is far longer than the profiler
|
|
// should ever run for a continuous period.
|
|
//
|
|
// With these tricks we can pack all of the above into a single 8 byte word.
|
|
// The second word is case dependent.
|
|
//
|
|
// One obvious question is: why manually tag the union rather than using a
|
|
// `std::variant`? (Or `c10::variant`, as it were.) The answer is that due
|
|
// to alignment the tag would have to be packed with the union data and
|
|
// `RawEvent` would grow to three words. (Not just 50% bigger, but also less
|
|
// cache friendly.)
|
|
struct RawEvent {
|
|
RawEvent(TraceTag tag, int lasti, TraceContext* ctx)
|
|
: tag_(static_cast<uint8_t>(tag)),
|
|
thread_id_(ctx->thread_id_),
|
|
lasti_(static_cast<uint16_t>(lasti)),
|
|
misc_() {
|
|
int64_t t = now() - ctx->initial_us_;
|
|
t_ = static_cast<uint32_t>(t);
|
|
|
|
TORCH_INTERNAL_ASSERT_DEBUG_ONLY(lasti <= std::numeric_limits<uint16_t>::max());
|
|
TORCH_INTERNAL_ASSERT_DEBUG_ONLY(t <= std::numeric_limits<uint32_t>::max());
|
|
}
|
|
|
|
RawEvent(TraceTag tag, int lasti, TraceContext* ctx, PyCodeObject* f_code)
|
|
: RawEvent(tag, lasti, ctx) {
|
|
TORCH_INTERNAL_ASSERT_DEBUG_ONLY(tag == TraceTag::kPy_Call);
|
|
misc_.f_code_ = f_code;
|
|
}
|
|
|
|
RawEvent(TraceTag tag, int lasti, TraceContext* ctx, PyObject* arg)
|
|
: RawEvent(tag, lasti, ctx) {
|
|
TORCH_INTERNAL_ASSERT_DEBUG_ONLY(tag == TraceTag::kC_Call);
|
|
misc_.arg_ = arg;
|
|
}
|
|
|
|
uint8_t tag_;
|
|
uint8_t thread_id_;
|
|
uint16_t lasti_;
|
|
uint32_t t_;
|
|
union {
|
|
// TraceTag::kPy_Call
|
|
PyCodeObject* f_code_;
|
|
|
|
// TraceTag::kC_Call
|
|
PyObject* arg_;
|
|
|
|
// TraceTag::kPy_Return
|
|
// TraceTag::kC_Return
|
|
// ** Unused (placeholder) **
|
|
void* null_;
|
|
} misc_;
|
|
|
|
C10_NODISCARD TraceTag tag() const {
|
|
return static_cast<TraceTag>(tag_);
|
|
}
|
|
|
|
C10_NODISCARD int lasti() const {
|
|
// f_lasti is positive, with one exception: CPython intializes frames
|
|
// with `f_lasti = -1`. We don't want to give up half of the range by
|
|
// switching to int16_t. So instead we do the fast (underflowing) cast
|
|
// in the ctor, and rectify the value in this accessor which should
|
|
// only be called during trace post processing.
|
|
return lasti_ == std::numeric_limits<uint16_t>::max()
|
|
? (int)(-1)
|
|
: (int)lasti_;
|
|
}
|
|
};
|
|
|
|
// Make sure the bit packing that we do in RawEvent actually results in the
|
|
// desired size reduction.
|
|
static_assert(sizeof(RawEvent) <= 16, "RawEvent is too large");
|
|
|
|
|
|
// std::hash doesn't have a specialization for pairs so we have to define one.
|
|
// A simple XOR is good enough for our purposes.
|
|
struct hash_pair {
|
|
template <class T1, class T2>
|
|
size_t operator() (const std::pair<T1, T2>& pair) const {
|
|
return std::hash<T1>()(pair.first) ^ std::hash<T2>()(pair.second);
|
|
}
|
|
};
|
|
|
|
|
|
// ============================================================================
|
|
// == Tracing implementation ==================================================
|
|
// ============================================================================
|
|
constexpr size_t max_py_threads = std::numeric_limits<uint8_t>::max() + 1;
|
|
|
|
class PythonTracer final {
|
|
public:
|
|
// Static methods serve as external interfaces (which expect raw pointers)
|
|
// and handle forwarding to the singleton.
|
|
static void call(Command c);
|
|
|
|
static int pyProfileFn(
|
|
PyObject* obj,
|
|
PyFrameObject* frame,
|
|
int what,
|
|
PyObject* arg);
|
|
|
|
private:
|
|
PythonTracer();
|
|
static PythonTracer& singleton();
|
|
friend class PyTraceReplay;
|
|
|
|
void start(size_t max_threads = max_py_threads);
|
|
void stop();
|
|
void clear();
|
|
|
|
void recordPyCall(TraceContext* ctx, PyFrameObject* frame);
|
|
void recordCCall(TraceContext* ctx, PyFrameObject* frame, PyObject* arg);
|
|
void recordReturn(TraceContext* ctx, PyFrameObject* frame, TraceTag tag);
|
|
|
|
void storeDescription(PyFrameObject* frame);
|
|
void trackModule(PyFrameObject* frame);
|
|
|
|
// It is imperitive that we do not store strings for each python function,
|
|
// as that would do terrible things to our profiling overhead. So instead
|
|
// we store the much cheaper pair of `PyCodeObject*` and `int` which we can
|
|
// pack into `RawEvent`, and then store a mapping to the full strings the
|
|
// first time we see a function.
|
|
//
|
|
// TODO:
|
|
// In theory we should be able to use a combination of Py_INCREF on
|
|
// `f_code` and string interning to skip this step. (Effectively reusing
|
|
// work that the CPython interpreter has already done.) However it tends
|
|
// to segfault and simply caching the strings is inexpensive.
|
|
struct CodeDescription {
|
|
CodeDescription(int line_no, std::string filename, std::string funcname)
|
|
: line_no_(line_no),
|
|
filename_(std::move(filename)),
|
|
funcname_(std::move(funcname)) {}
|
|
int line_no_;
|
|
std::string filename_;
|
|
std::string funcname_;
|
|
};
|
|
|
|
struct ModuleForward {
|
|
ModuleForward(size_t event_index, PyObject* self)
|
|
: event_index_(event_index), self_(self) {}
|
|
size_t event_index_;
|
|
|
|
// NB:
|
|
// This is a non-owning reference to keep `ModuleForward` POD;
|
|
// `PythonTracer` owns the contents instead. We Py_INCREF in
|
|
// `trackModule`, and `reset` is responsible for calling Py_DECREF
|
|
// when clearing `module_calls_`.
|
|
PyObject* self_;
|
|
};
|
|
|
|
bool active_;
|
|
PyObject* module_call_code_;
|
|
std::string path_prefixes_;
|
|
std::vector<TraceContext*> trace_contexts_;
|
|
|
|
std::vector<RawEvent> events_;
|
|
std::vector<ModuleForward> module_calls_;
|
|
|
|
using DescriptionKey = std::pair</*f_code=*/PyCodeObject*, /*f_lasti=*/int>;
|
|
ska::flat_hash_map<DescriptionKey, CodeDescription, hash_pair> code_descriptions_;
|
|
};
|
|
|
|
PythonTracer& PythonTracer::singleton() {
|
|
static PythonTracer singleton_;
|
|
return singleton_;
|
|
}
|
|
|
|
PythonTracer::PythonTracer() : active_(false) {
|
|
path_prefixes_ = py::module::import("torch.profiler.python_tracer")
|
|
.attr("_prefix_regex")().cast<std::string>();
|
|
|
|
module_call_code_ = py::module::import("torch.nn")
|
|
.attr("Module")
|
|
.attr("__call__")
|
|
.attr("__code__")
|
|
.ptr();
|
|
}
|
|
|
|
void PythonTracer::start(size_t max_threads) {
|
|
TORCH_CHECK(!active_, "PythonTracer is already active")
|
|
TORCH_CHECK(!trace_contexts_.size(), "PythonTracer should not have active contexts");
|
|
TORCH_CHECK(max_threads > 0, "max_threads must be positive, got ", max_threads);
|
|
TORCH_CHECK(
|
|
max_threads <= max_py_threads,
|
|
"max_threads must be less than or equal to ", max_py_threads);
|
|
|
|
pybind11::gil_scoped_acquire gil;
|
|
auto t0 = now();
|
|
|
|
// Loop over all threads within the current interpreter. We will need to
|
|
// register a trace function with each thread. We set the current thread to
|
|
// position zero to ensure that it is traced, and so we can restore the
|
|
// thread state after registration.
|
|
std::vector<PyThreadState*> thread_states { PyThreadState_Get() };
|
|
if (max_threads > 1) {
|
|
auto thread_state = thread_states[0];
|
|
while (thread_state != nullptr) {
|
|
if (thread_state != thread_states[0]) {
|
|
thread_states.push_back(thread_state);
|
|
}
|
|
thread_state = PyThreadState_Next(thread_state);
|
|
}
|
|
|
|
if (thread_states.size() > max_threads) {
|
|
std::cout << "Warning: can only trace " << max_threads << " threads. "
|
|
<< thread_states.size() << " are currently active." << std::endl;
|
|
thread_states.resize(max_threads);
|
|
}
|
|
}
|
|
|
|
// Register the tracer in each thread.
|
|
for (size_t i = 0; i < thread_states.size(); i++) {
|
|
PyThreadState* thread_state = thread_states[i];
|
|
PyThreadState_Swap(thread_state);
|
|
|
|
auto ctx = (TraceContext*) TraceContextType.tp_alloc(&TraceContextType, 0);
|
|
ctx->thread_id_ = (uint8_t)i;
|
|
ctx->thread_state_ = thread_state;
|
|
ctx->initial_us_ = t0;
|
|
trace_contexts_.push_back(ctx);
|
|
|
|
// When we begin profiling there are already frames on the Python
|
|
// interpreter stack. To ensure a complete trace, we must push calls
|
|
// to all the prior frames onto our event stack. (We stop at depth=128)
|
|
std::vector<PyFrameObject*> current_stack;
|
|
auto frame = PyEval_GetFrame();
|
|
size_t depth = 0; // Make sure we can't infinite loop.
|
|
while (frame != nullptr && depth <= 128) {
|
|
current_stack.push_back(frame);
|
|
frame = frame->f_back;
|
|
depth++;
|
|
}
|
|
for (auto it = current_stack.rbegin(); it != current_stack.rend(); it++) {
|
|
recordPyCall(ctx, *it);
|
|
}
|
|
|
|
// Note:
|
|
// This profile will not compose with other CPython profilers, and
|
|
// cannot be round tripped via `sys.settrace(sys.gettrace())`
|
|
PyEval_SetProfile(PythonTracer::pyProfileFn, (PyObject*)ctx);
|
|
}
|
|
|
|
// Restore the thread state to its initial value.
|
|
PyThreadState_Swap(thread_states[0]);
|
|
|
|
active_ = true;
|
|
};
|
|
|
|
void PythonTracer::stop() {
|
|
TORCH_INTERNAL_ASSERT(active_, "PythonTracer is not running.")
|
|
|
|
pybind11::gil_scoped_acquire gil;
|
|
|
|
PyThreadState* initial_thread_state = PyThreadState_Get();
|
|
for (const auto i : trace_contexts_) {
|
|
PyThreadState_Swap(i->thread_state_);
|
|
PyEval_SetProfile(nullptr, nullptr);
|
|
}
|
|
PyThreadState_Swap(initial_thread_state);
|
|
active_ = false;
|
|
}
|
|
|
|
|
|
void PythonTracer::clear() {
|
|
TORCH_CHECK(!active_, "Cannot clear state while PythonTracer is active.");
|
|
for (auto i : trace_contexts_) {
|
|
Py_DECREF((PyObject*) i);
|
|
}
|
|
trace_contexts_.clear();
|
|
events_.clear();
|
|
code_descriptions_.clear();
|
|
for (auto& i : module_calls_) {
|
|
Py_DECREF(i.self_);
|
|
}
|
|
module_calls_.clear();
|
|
}
|
|
|
|
void PythonTracer::recordPyCall(TraceContext* ctx, PyFrameObject* frame) {
|
|
events_.emplace_back(TraceTag::kPy_Call, frame->f_lasti, ctx, frame->f_code);
|
|
storeDescription(frame);
|
|
trackModule(frame);
|
|
}
|
|
|
|
void PythonTracer::recordCCall(TraceContext* ctx, PyFrameObject* frame, PyObject* arg) {
|
|
events_.emplace_back(TraceTag::kC_Call, frame->f_lasti, ctx, arg);
|
|
}
|
|
|
|
void PythonTracer::recordReturn(TraceContext* ctx, PyFrameObject* frame, TraceTag tag) {
|
|
events_.emplace_back(tag, frame->f_lasti, ctx);
|
|
}
|
|
|
|
// NB:
|
|
// `frame->f_lasti` will advance as the interpreter progresses through the
|
|
// code object. Thus, we need to call `storeDescription` when we record the
|
|
// call rather than the return. (Otherwise we would get the line with the
|
|
// return stmt.)
|
|
void PythonTracer::storeDescription(PyFrameObject* frame) {
|
|
const auto& it = code_descriptions_.find({ frame->f_code, frame->f_lasti });
|
|
if C10_UNLIKELY(it == code_descriptions_.end()) {
|
|
code_descriptions_.insert({
|
|
{ frame->f_code, frame->f_lasti },
|
|
{
|
|
/*line_no=*/ PyCode_Addr2Line(frame->f_code, frame->f_lasti),
|
|
/*filename=*/ THPUtils_unpackString(frame->f_code->co_filename),
|
|
/*funcname=*/ THPUtils_unpackString(frame->f_code->co_name)
|
|
}
|
|
});
|
|
}
|
|
}
|
|
|
|
void PythonTracer::trackModule(PyFrameObject* frame) {
|
|
if ((PyObject*)(frame->f_code) == module_call_code_) {
|
|
// By default, CPython stores locals in a "fast" format, with an array
|
|
// of names and an array of values. Consequently, frame->f_locals is
|
|
// NULL since the interpreter has no need to populate it.
|
|
//
|
|
// If these arrays were part of the public API then we could very
|
|
// quickly access `self`. Unfortunately they are not, and moreover are
|
|
// not stable across versions. As a result, we are forced to call
|
|
// `PyFrame_FastToLocals` which forces the interpreter to materialize
|
|
// the full dict of locals.
|
|
PyFrame_FastToLocals(frame);
|
|
auto self = PyDict_GetItemString(frame->f_locals, "self");
|
|
Py_INCREF(self);
|
|
module_calls_.emplace_back(
|
|
/*event_index=*/events_.size() - 1,
|
|
/*self=*/self
|
|
);
|
|
PyFrame_LocalsToFast(frame, 0);
|
|
}
|
|
};
|
|
|
|
|
|
// ============================================================================
|
|
// == Post processing =========================================================
|
|
// ============================================================================
|
|
|
|
class PyTraceReplay {
|
|
public:
|
|
static std::vector<std::unique_ptr<PyTraceEvent>> getEvents() {
|
|
return PyTraceReplay().replayStack();
|
|
}
|
|
|
|
private:
|
|
PyTraceReplay();
|
|
std::vector<std::unique_ptr<PyTraceEvent>> replayStack() const;
|
|
|
|
struct ReplayFrame {
|
|
std::unique_ptr<PyTraceEvent> event_;
|
|
size_t id_;
|
|
size_t parent_id_;
|
|
};
|
|
|
|
ska::flat_hash_map<size_t, PyObject*> module_self_map_;
|
|
ska::flat_hash_map<size_t, std::string> module_name_map_;
|
|
std::regex filename_prune_;
|
|
};
|
|
|
|
PyTraceReplay::PyTraceReplay()
|
|
: filename_prune_(PythonTracer::singleton().path_prefixes_) {
|
|
ska::flat_hash_map<PyObject*, std::string> module_names;
|
|
for (const auto& call : PythonTracer::singleton().module_calls_) {
|
|
if (module_names.find(call.self_) == module_names.end()) {
|
|
std::stringstream name_stream;
|
|
auto py_class_name = py::handle(call.self_)
|
|
.attr("__class__")
|
|
.attr("__name__");
|
|
name_stream << "nn.Module: " << py::str(py_class_name);
|
|
module_names.insert({ call.self_, name_stream.str() });
|
|
}
|
|
|
|
module_self_map_.insert({ call.event_index_, call.self_ });
|
|
module_name_map_.insert({ call.event_index_, module_names.at(call.self_) });
|
|
}
|
|
}
|
|
|
|
|
|
std::vector<std::unique_ptr<PyTraceEvent>> PyTraceReplay::replayStack() const {
|
|
const auto& tracer = PythonTracer::singleton();
|
|
|
|
// We want to prune paths to a sensible prefix. For example
|
|
// `/foo/bar/baz/site-packages/torch/__init__.py` -> `torch/__init__.py`
|
|
// Pruning the path prefix is somewhat expensive, so we cache it.
|
|
ska::flat_hash_map<std::string, std::string> filename_map;
|
|
for (const auto& i : tracer.code_descriptions_) {
|
|
if (filename_map.find(i.second.filename_) == filename_map.end()) {
|
|
auto s = std::regex_replace(i.second.filename_, filename_prune_, "");
|
|
filename_map[i.second.filename_] = s;
|
|
}
|
|
}
|
|
|
|
auto py_name = [&](const RawEvent& e) {
|
|
const auto& desc_it = tracer.code_descriptions_.find({e.misc_.f_code_, e.lasti()});
|
|
if (desc_it != tracer.code_descriptions_.end()) {
|
|
std::stringstream name_stream;
|
|
name_stream << filename_map.at(desc_it->second.filename_) << "("
|
|
<< desc_it->second.line_no_ << "): " << desc_it->second.funcname_;
|
|
return name_stream.str();
|
|
}
|
|
return std::string("Python: ???");
|
|
};
|
|
|
|
size_t id_counter = 0;
|
|
std::vector<std::vector<ReplayFrame>> stacks(tracer.trace_contexts_.size());
|
|
std::vector<ReplayFrame> results;
|
|
|
|
// Match calls and returns.
|
|
size_t event_idx = 0;
|
|
for (auto& raw_event : tracer.events_) {
|
|
auto& stack = stacks[raw_event.thread_id_];
|
|
auto ctx = tracer.trace_contexts_[raw_event.thread_id_];
|
|
auto t = static_cast<int64_t>(raw_event.t_) + ctx->initial_us_;
|
|
|
|
auto push_frame = [&](std::string name, CallType call_type, size_t module_id = 0) {
|
|
stack.push_back(ReplayFrame {
|
|
/*event_=*/ std::make_unique<PyTraceEvent>(PyTraceEvent{
|
|
/*startTime_=*/ t,
|
|
/*endTime_=*/ -1, // Placeholder
|
|
/*name_=*/ name,
|
|
/*thread_id_=*/ raw_event.thread_id_,
|
|
/*parent_=*/ nullptr, // Placeholder
|
|
/*call_type_=*/ call_type,
|
|
/*module_id_=*/ module_id,
|
|
/*call_idx_=*/ event_idx,
|
|
/*return_idx_=*/ 0 // Placeholder
|
|
}),
|
|
/*id_=*/ id_counter++,
|
|
/*parent_id_=*/ stack.size() ? stack.back().id_ : 0,
|
|
});
|
|
};
|
|
|
|
switch (raw_event.tag()) {
|
|
case TraceTag::kPy_Call:
|
|
if (module_name_map_.find(event_idx) != module_name_map_.end()) {
|
|
push_frame(
|
|
module_name_map_.at(event_idx),
|
|
CallType::kPyModuleCall,
|
|
reinterpret_cast<size_t>(module_self_map_.at(event_idx)));
|
|
} else {
|
|
push_frame(py_name(raw_event), CallType::kPyCall);
|
|
}
|
|
break;
|
|
|
|
case TraceTag::kC_Call:
|
|
push_frame(py::repr(raw_event.misc_.arg_), CallType::kCCall);
|
|
break;
|
|
|
|
case TraceTag::kPy_Return:
|
|
case TraceTag::kC_Return:
|
|
TORCH_INTERNAL_ASSERT(stack.size(), "Python replay stack is empty.")
|
|
stack.back().event_->endTime_ = t;
|
|
stack.back().event_->return_idx_ = event_idx;
|
|
results.push_back(std::move(stack.back()));
|
|
stack.pop_back();
|
|
break;
|
|
}
|
|
event_idx++;
|
|
}
|
|
|
|
// Cleanup by feining return to close out the stack. This is needed so
|
|
// frames above the one that called the profiler still appear in the trace.
|
|
const auto t_final = now();
|
|
for (auto& stack : stacks) {
|
|
while (stack.size()) {
|
|
stack.back().event_->endTime_ = t_final;
|
|
stack.back().event_->return_idx_ = event_idx;
|
|
results.push_back(std::move(stack.back()));
|
|
stack.pop_back();
|
|
event_idx++;
|
|
}
|
|
}
|
|
|
|
// Convert to `PyTraceEvent`, and map id to pointer.
|
|
ska::flat_hash_map<size_t, PyTraceEvent*> event_id_map {{0, nullptr}};
|
|
std::vector<std::unique_ptr<PyTraceEvent>> out;
|
|
for (auto& r : results) {
|
|
out.push_back(std::move(r.event_));
|
|
event_id_map.insert({r.id_, out.back().get()});
|
|
}
|
|
|
|
// Link parents to children.
|
|
for (int i = 0; i < results.size(); i++) {
|
|
out[i]->parent_ = event_id_map[results[i].parent_id_];
|
|
}
|
|
|
|
return out;
|
|
}
|
|
|
|
|
|
// ============================================================================
|
|
// == API =====================================================================
|
|
// ============================================================================
|
|
|
|
int PythonTracer::pyProfileFn(
|
|
PyObject* obj,
|
|
PyFrameObject* frame,
|
|
int what,
|
|
PyObject* arg) {
|
|
auto ctx = reinterpret_cast<TraceContext*>(obj);
|
|
switch (what) {
|
|
case PyTrace_CALL:
|
|
PythonTracer::singleton().recordPyCall(ctx, frame);
|
|
break;
|
|
|
|
case PyTrace_C_CALL:
|
|
PythonTracer::singleton().recordCCall(ctx, frame, arg);
|
|
break;
|
|
|
|
case PyTrace_EXCEPTION:
|
|
case PyTrace_RETURN:
|
|
PythonTracer::singleton().recordReturn(ctx, frame, TraceTag::kPy_Return);
|
|
break;
|
|
|
|
case PyTrace_C_EXCEPTION:
|
|
case PyTrace_C_RETURN:
|
|
PythonTracer::singleton().recordReturn(ctx, frame, TraceTag::kC_Return);
|
|
break;
|
|
}
|
|
return 0;
|
|
}
|
|
|
|
void PythonTracer::call(Command c) {
|
|
switch (c) {
|
|
case Command::kStartOne:
|
|
PythonTracer::singleton().start(1);
|
|
break;
|
|
|
|
case Command::kStartAll:
|
|
PythonTracer::singleton().start();
|
|
break;
|
|
|
|
case Command::kStop:
|
|
PythonTracer::singleton().stop();
|
|
break;
|
|
|
|
case Command::kClear:
|
|
PythonTracer::singleton().clear();
|
|
break;
|
|
|
|
default:
|
|
break;
|
|
}
|
|
};
|
|
|
|
} // namespace
|
|
|
|
void init() {
|
|
pybind11::gil_scoped_acquire gil;
|
|
TORCH_CHECK(PyType_Ready(&TraceContextType) == 0);
|
|
|
|
registerFunctions(
|
|
/*call=*/&PythonTracer::call,
|
|
/*get_events=*/&PyTraceReplay::getEvents
|
|
);
|
|
}
|
|
|
|
}}}} // namespace torch::autograd::profiler::python_tracer
|