Summary:
This is a copy of https://github.com/pytorch/pytorch/pull/97152 to make
the landing easier.

This PR implements a two-pass wrapper codegen for the Triton
backend to achieve ahead-of-time compilation. In the first pass, the
regular python wrapper code will be generated, and then the generated
code will be executed to perform Triton compilation and autotuning.
After that, the second pass wrapper codegen will generate C++ wrapper
with proper CUDA API to load and launch Triton-generated CUDA kernels.

Like the AOT mode for the cpp backend, the next step would be to provide
a more complete API for AOT.

Pull Request resolved: https://github.com/pytorch/pytorch/pull/98214
Approved by: https://github.com/eellison
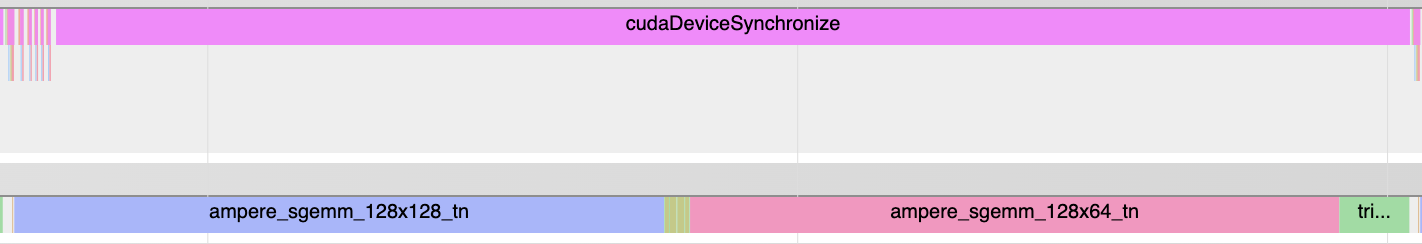
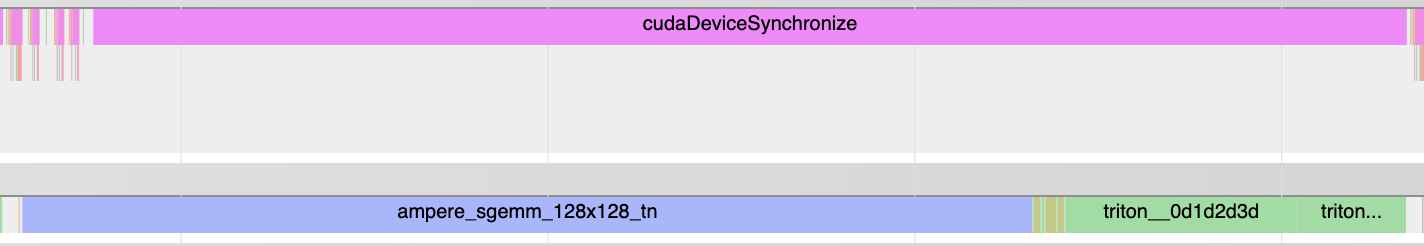
Following metrics should be helpful:
- percent of time GPU is busy
- percent of time various category of kernels (e.g. pointwise/reduction triton kernel) takes
- percent of time each individual kernel takes compared to total wall time of the benchmark

This PR add those.

Example result from hf_Bert infernece graph:

```
  == triton_pointwise category kernels ==
Kernel                            Self CUDA TIME (ms)  Count    Percent
------------------------------  ---------------------  -------  ---------
triton_poi_fused_gelu_6_0d1d                  0.48154  12.0     5.52%
triton_poi_fused_clone_1_0d1d2                0.29011  24.0     3.33%
triton_poi_fused_clone_2_0d1d2                0.17417  12.0     2.00%
triton_poi_fused_clone_4_0d1d2                0.10797  12.0     1.24%
Total                                         1.05379           12.08%

  == triton_persistent_reduction category kernels ==
Kernel                            Self CUDA TIME (ms)  Count    Percent
------------------------------  ---------------------  -------  ---------
triton_per_fused__softmax__to_                0.97188  12.0     11.14%
triton_per_fused_add_native_la                0.37401  24.0     4.29%
triton_per_fused_gelu_native_l                0.02     1.0      0.23%
triton_per_fused_add_embedding                0.01718  1.0      0.20%
Total                                         1.38307           15.86%

  == unknown category kernels ==
Kernel                            Self CUDA TIME (ms)  Count    Percent
------------------------------  ---------------------  -------  ---------
ampere_fp16_s16816gemm_fp16_12                2.24514  24.0     25.74%
ampere_fp16_s16816gemm_fp16_25                1.39796  49.0     16.03%
void cutlass::Kernel<cutlass_8                1.36093  1.0      15.61%
ampere_fp16_s16816gemm_fp16_64                0.74591  12.0     8.55%
ampere_fp16_s16816gemm_fp16_12                0.61989  12.0     7.11%
Memset (Device)                               0.024    12.0     0.28%
void at::native::(anonymous na                0.01543  2.03     0.18%
void at::native::vectorized_el                0.00011  0.03     0.00%
Total                                         6.40937           73.49%

Percent of time when GPU is busy: 101.44%
```

Note: the output shows total time GPU is busy is larger than total wall time. We measure total wall time disabling profiling while measure GPU time enabling profiling, that may distort the measurement a bit? But I assume the effect is not too large assuming the profiler mostly increase CPU time (rather than GPU).

## interesting usages
1. I pick a model that cudagraphs improve perf significantly like densenet121 and run the tool on it's forward graph. It's no surprise that quite a lot of time GPU is idle:
```
(Forward graph) Percent of time when GPU is busy: 32.69%
Total wall time 17.307 ms
```

Its backward graph has less percent of GPU idle time, but it's still high:
```
(Backward graph) Percent of time when GPU is busy: 46.70%
Total wall time 17.422 ms
```

2. I profile a subset of torchbench models and plot a table to show the percent of execution time for pointwise/reduction/persistent_reduction/unknown_category . Since I plan to explore using coordinate descent tuner to improve reduction, those models with high percent of time spending on reduction should be good caididates (e.g. resnet50, mobilenet_v2 ).

NOTE: a same model appears twice. The first rows is for the fwd graph and the second for the bwd graph. We profile different graphs for a model separately.

```
benchmark_name           pointwise_percent    reduction_percent    persistent_reduction_percent    unknown_category_percent    GPU_busy_percent    wall_time_ms
-----------------------  -------------------  -------------------  ------------------------------  --------------------------  ------------------  --------------
resnet18                 19.73%               7.86%                4.81%                           41.25%                      73.65%              2.549ms
resnet18                 18.59%               7.13%                3.35%                           67.35%                      96.41%              3.467ms
resnet50                 29.57%               22.13%               2.07%                           51.68%                      105.46%             6.834ms
resnet50                 26.42%               15.27%               0.94%                           59.68%                      102.31%             13.346ms
vgg16                    26.23%               0.00%                0.00%                           74.20%                      100.43%             18.212ms
vgg16                    15.63%               5.61%                0.10%                           79.42%                      100.75%             33.485ms
BERT_pytorch             28.62%               4.82%                14.88%                          33.32%                      81.64%              7.162ms
BERT_pytorch             14.43%               13.41%               18.19%                          49.24%                      95.27%              10.395ms
densenet121              11.89%               2.14%                3.86%                           16.36%                      34.25%              16.531ms
densenet121              10.37%               2.06%                4.09%                           31.46%                      47.98%              16.934ms
hf_Bert                  23.94%               0.00%                29.88%                          46.09%                      99.90%              7.766ms
hf_Bert                  11.65%               10.54%               20.26%                          61.66%                      104.11%             11.892ms
nvidia_deeprecommender   42.92%               0.00%                0.00%                           56.75%                      99.67%              3.476ms
nvidia_deeprecommender   31.36%               3.44%                0.46%                           65.20%                      100.45%             3.872ms
alexnet                  30.99%               0.00%                0.00%                           69.16%                      100.14%             3.169ms
alexnet                  24.41%               4.83%                0.17%                           71.09%                      100.50%             4.709ms
mobilenet_v2             29.21%               27.79%               2.49%                           44.00%                      103.49%             10.160ms
mobilenet_v2             17.50%               15.05%               1.06%                           69.68%                      103.29%             20.715ms
resnext50_32x4d          18.96%               9.28%                2.31%                           28.79%                      59.33%              5.899ms
resnext50_32x4d          18.48%               11.01%               1.86%                           53.80%                      85.14%              7.167ms
mnasnet1_0               19.07%               14.52%               3.01%                           35.43%                      72.03%              6.028ms
mnasnet1_0               14.17%               12.00%               1.87%                           67.56%                      95.60%              9.225ms
squeezenet1_1            38.56%               0.00%                1.77%                           56.21%                      96.53%              2.221ms
squeezenet1_1            21.26%               7.57%                1.05%                           67.30%                      97.18%              4.942ms
timm_vision_transformer  17.05%               0.00%                18.80%                          65.79%                      101.64%             9.608ms
timm_vision_transformer  9.31%                9.07%                10.32%                          73.25%                      101.96%             16.814ms
```

## how to use
`python {compiled_module_wrapper.py} -p`

Pull Request resolved: https://github.com/pytorch/pytorch/pull/97723
Approved by: https://github.com/jansel
V.graph.constants like seed_cuda_0 is not handled properly in the wrapper. Recently we move the code that initializes constants from global scope to a function. That makes assigning to seed_cuda_0 creating a new local variable rather than setup the global variable.

Add 'global var_name' lines to maintain the same behavior as before.

Test:

Run the forward graph for nvidia_deeprecommender's training run. Previous fail and now pass with the fix.

Thanks @ngimel  for report the issue with repro and @Chillee  for pointing out the root cause.

Pull Request resolved: https://github.com/pytorch/pytorch/pull/97571
Approved by: https://github.com/ngimel
This is a follow up for PR #95506 to run all the triton kernels in a compiled module individually as suggested by Horace.
Here are the steps:
1. Run the model as usual with a benchmark script and with TORCHINDUCTOR_BENCHMARK_KERNEL enabled. e.g.
```
TORCHINDUCTOR_BENCHMARK_KERNEL=1 python benchmarks/dynamo/torchbench.py --backend inductor --amp --performance --dashboard --only resnet18 --disable-cudagraphs --training
```
2. From the output we will see 3 lines like
```
Compiled module path: /tmp/torchinductor_shunting/rs/crsuc6zrt3y6lktz33jjqgpkuahya56xj6sentyiz7iv4pjud43j.py
```
That's because we have one graph module for fwd/bwd/optitimizer respectively. Each graph module will have one such output corresponding to the compiled module.
3. We can run the compiled module directly. Without any extra arguments, we just maintain the previous behavior to run the call function -- which just does what the original graph module does but in a more efficient way. But if we add the '-k' argument, we will run benchmark for each individual kernels in the file.
```
python /tmp/torchinductor_shunting/rs/crsuc6zrt3y6lktz33jjqgpkuahya56xj6sentyiz7iv4pjud43j.py -k
```
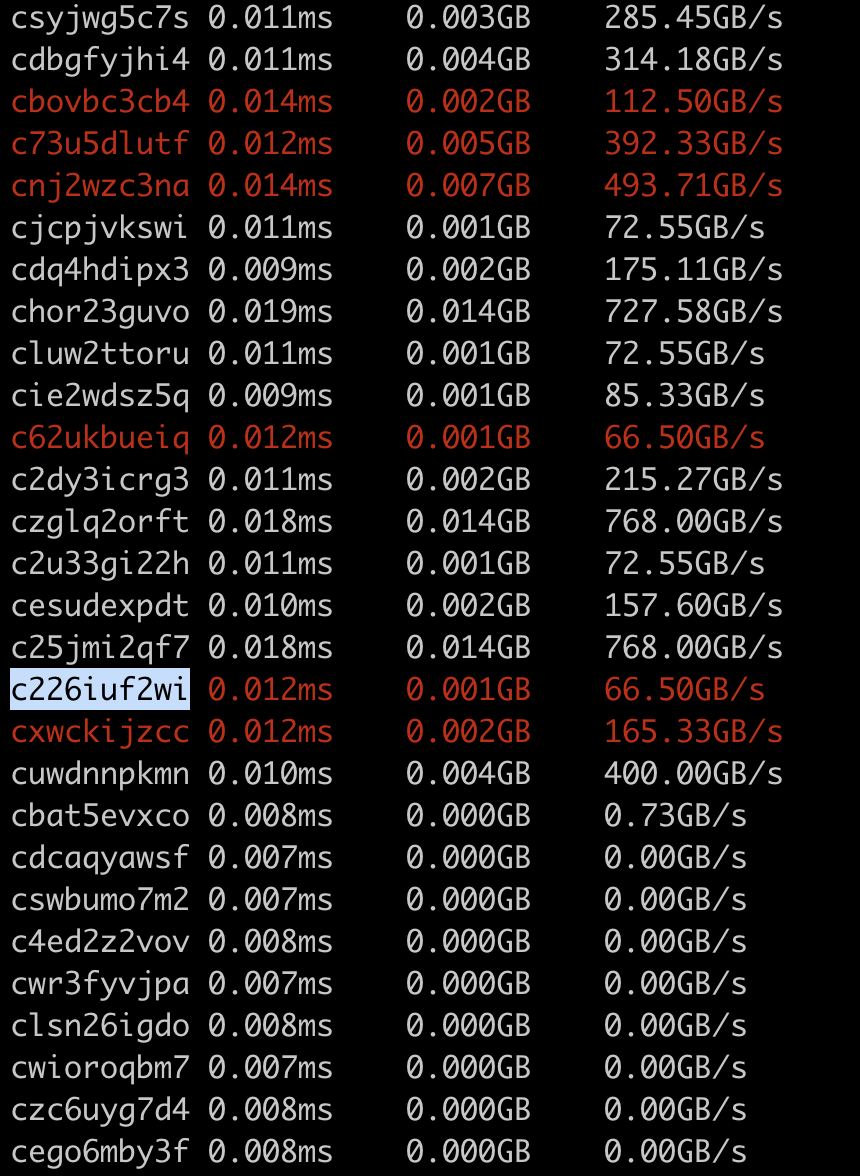
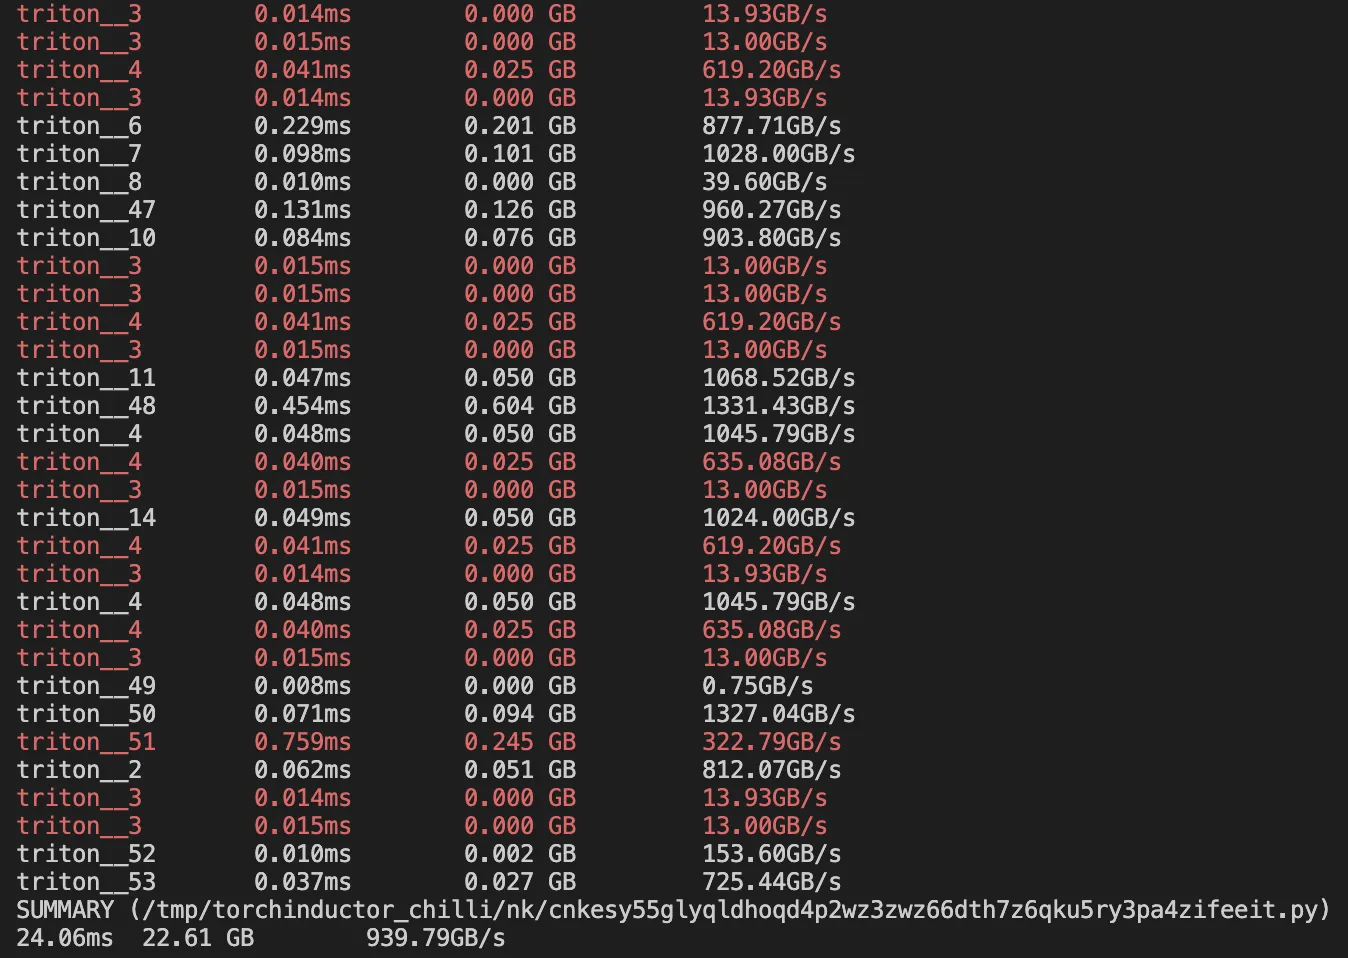
Example output:
<img width="430" alt="Screenshot 2023-03-01 at 4 51 06 PM" src="https://user-images.githubusercontent.com/52589240/222302996-814a85be-472b-463c-9e85-39d2c9d20e1a.png">
Note: I use the first 10 characters of the hash to identify each kernel since
1. hash is easier to get in the code :)
2. name like `triton__3` only makes sense within a compiled module, but a hash can make sense even without specifying the compiled module (assuming we have enough bytes for the hash)
If we found a triton kernel with hash like c226iuf2wi having poor performance, we can look it up in the original compiled module file. It works since we comment each compiled triton kernel with the full hash.
Pull Request resolved: https://github.com/pytorch/pytorch/pull/95845
Approved by: https://github.com/Chillee
Summary: The AOT mode currently works for the CPP backend. When turned on, Inductor compiles the model code into a .so file with aot_inductor_entry as the entry function. If the AOT compilation fails, Inductor will explicitly fail.

Pull Request resolved: https://github.com/pytorch/pytorch/pull/94822
Approved by: https://github.com/jansel
Inductor implementations of collectives/wait must match
eager impls in _functional_collectives in terms of interacting
with _register_tensor_work API.  If they do, then splitting
a collective-wait pair so one half is in a compiled graph should
work fine.

Pull Request resolved: https://github.com/pytorch/pytorch/pull/95893
Approved by: https://github.com/kumpera
A PR to generate benchmark code for individual triton kernels. We can explore improving autotuning with the saved compiled kernel directly. This potentially can speedup our iteration and separate the concern with the upstream components that generate the compiled module.
Since I'm still ramping up on inductor, I'll reflect what I learned here so people can correct me if I'm wrong. In inductor, WrapperCodeGen class is used to generate the compiled module for CUDA (or triton). Here is an example compiled module for a toy model like: `def f(x): return sin(x) + cos(x)` https://gist.github.com/shunting314/c6ed9f571919e3b414166f1696dcc61b . A compiled module contains the following part:
- various triton kernels
- a wrapper (or a method named call . The name is hardcoded) that calls the triton kernels and potentially ATen kernels to efficiently do the same work as the original Fx graph being compiled by inductor
- some utility code that generate random inputs and run the wrapper
The triton kernels in the compiled module are annotated with decorator like pointwise which is used for autotuning.
This PR add a config so enabling it will just trigger the path of the compiled module being printed. It can be controlled from environment variable as well.
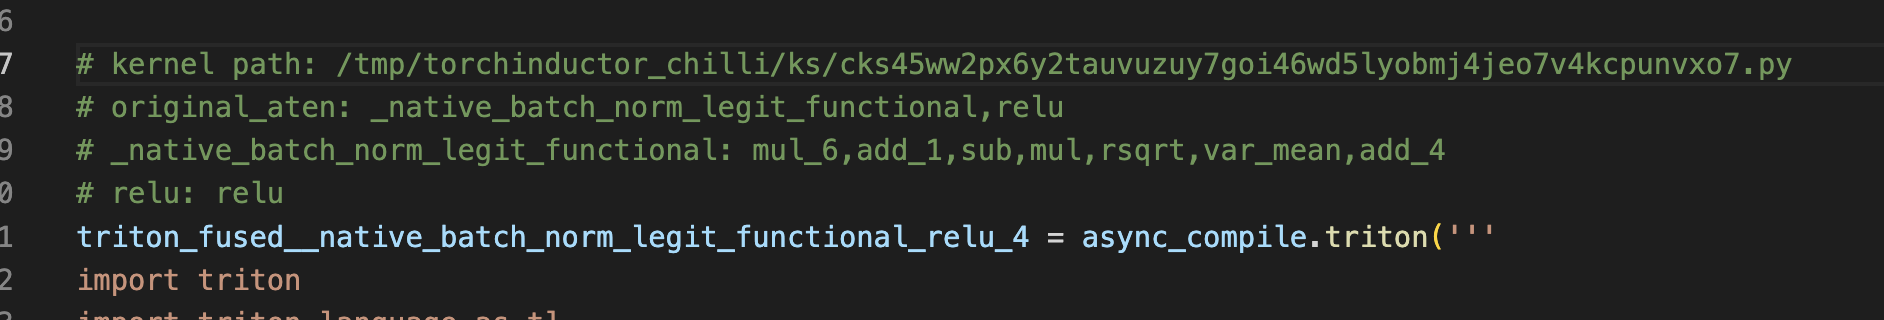
The path to each compiled triton kernel is added as comment in the compiled module. E.g.
```
# kernel path: /tmp/torchinductor_shunting/gn/cgn6x3mqoltu7q77gjnu2elwfupinsvcovqwibc6fhsoiy34tvga.py
triton__0 = async_compile.triton('''
import triton
import triton.language as tl
...
""")
````
Example command:
```
TORCHINDUCTOR_OUTPUT_COMPILED_MODULE_PATH=1 TORCHINDUCTOR_BENCHMARK_KERNEL=1 python benchmarks/dynamo/huggingface.py --backend inductor --amp --performance --training --dashboard --only AlbertForMaskedLM --disable-cudagraphs
```
Pull Request resolved: https://github.com/pytorch/pytorch/pull/95506
Approved by: https://github.com/Chillee
Summary:
update the hashing method for `ChoiceCaller` class.

`TritonTemplateCaller` objects will now be hashed to:
`{name}-({BLOCK_M}, {BLOCK_N}, {BLOCK_K})-{num_stages}-{num_warps}-{code_hash}`

for example:
`triton_mm-(64, 32, 32)-4-8-cptlntwzcl2gaaofd2oabdwhaqv4ox3lluvbuxitjfhhpz6cyl4o`

`ExternKernelCaller` objects will now be hashed to:
`{name}-{kwargs.keys()[0]}={kwargs.vals()[0]}-...-{code_hash}`

for example:
`addmm-alpha=1-beta=1-c4xxd3iocu4yt6z4udrlqnumays7q6mfnfd3qprh4fxgsvyhqdkf`

Test Plan: sandcastle

Differential Revision: D43285470

Pull Request resolved: https://github.com/pytorch/pytorch/pull/94853
Approved by: https://github.com/jansel, https://github.com/bertmaher
This adds `torch.cuda._DeviceGuard` which is a stripped down version of
`torch.cuda.device` with lower overhead. To do this, it only accepts `int` as
the device so we don't need to call `_get_device_index` and is implemented
with a new C++ helper `torch._C._cuda_exchangeDevice` that allows
`_DeviceGuard.__enter__` to be just a single function call. On my machine,
I see a drop from 3.8us of overhead to 0.94 us with this simple benchmark:

```python
def set_device():
    with torch.cuda.device(0):
        pass

%timeit set_device()
```

Pull Request resolved: https://github.com/pytorch/pytorch/pull/91045
Approved by: https://github.com/ngimel, https://github.com/anijain2305
Fixes https://github.com/pytorch/torchdynamo/issues/1717, https://github.com/pytorch/torchdynamo/issues/1990

<s>TODO: add test with multiple devices, figure out extra context initialization</s>

Problems:
<s>It still initializes context on 0-th device that it shouldn't, I'll take a look where that happens and fix before landing</s>
It adds a python device context manages, that is absurdly slow and takes ~2.5 us (should be nanoseconds). That's not a problem for real models, because it'll be called just once, but it is a bit of an inconvenience for microbenchmarking, we should make that context manager more performant (won't fix in this PR)
It still can have bugs for graphs that run on multiple devices and can have buffers incorrectly shared between multiple device by memory reuse, if that happens that'll need to be solved separately.

Generated code:
```
def call(args):
    arg0_1, arg1_1 = args
    args.clear()
    with torch.cuda.device(1):
        buf0 = empty_strided((4, ), (1, ), device='cuda', dtype=torch.float32)
        stream1 = get_cuda_stream(1)
        triton_fused_div_0.run(arg0_1, arg1_1, buf0, 4, grid=grid(4), stream=stream1)
        del arg0_1
        del arg1_1
        return (buf0, )
```

Pull Request resolved: https://github.com/pytorch/pytorch/pull/90934
Approved by: https://github.com/wconstab
## Pitch
Change input args type from `std::tuple` to `std::vector` to reduce the compilation time.

## Description
`std::tie()` takes quite a long time during the compilation when the input args number grows.

For example, for a graph from the `PegasusForConditionalGeneration` model with 318 input args, the compilation of `std::tie` for the args is about 10s. By changing to std::vector, the compilation time of arg assignment is reduced to less than 1s.

### Code before:
```cpp
at::Tensor call_0(std::tuple<at::Tensor&, at::Tensor&> args) {
    at::Tensor arg0_1, arg1_1;
    std::tie(arg0_1, arg1_1) = args;
    ...
    return buf0;
}
```

### Code after:
```cpp
at::Tensor call_0(std::vector<at::Tensor> args) {
    at::Tensor arg0_1, arg1_1;
    arg0_1 = args[0];
    arg1_1 = args[1];
    ...
    return buf0;
}
```

Pull Request resolved: https://github.com/pytorch/pytorch/pull/90754
Approved by: https://github.com/jgong5, https://github.com/jansel
For reductions, the code string in the codegen stage and the execution stage are different due to `\`.

- The code string gotten from `code.getvalue()` (`code` is an `IndentedBuffer`) in codegen stage:
  ```
  #pragma omp declare reduction(argmax : struct IndexValue_1 :\
                  omp_out.value = omp_in.value < omp_out.value ? omp_out.value : omp_in.value,\
                  omp_out.index = omp_in.value < omp_out.value ? omp_out.index : omp_in.index)\
                  initializer(omp_priv = {0, -std::numeric_limits<float>::infinity()})
  ```

- The code string loaded during the execution (`\` will be escaped):
  ```
  #pragma omp declare reduction(argmax : struct IndexValue_1 :                omp_out.value = omp_in.value < omp_out.value ? omp_out.value : omp_in.value,                omp_out.index = omp_in.value < omp_out.value ? omp_out.index : omp_in.index)                  initializer(omp_priv = {0, -std::numeric_limits<float>::infinity()})
  ```

Thus we can't get the same hash value for these two pieces of code.
This PR adds a function to make the transformation escape the backslash in the codegen stage.

Pull Request resolved: https://github.com/pytorch/pytorch/pull/88561
Approved by: https://github.com/jgong5, https://github.com/jansel, https://github.com/desertfire