Introduces two higher order operators
* run_and_save_rng_state - Saves the current rng state and then runs the op.
* run_with_rng_state - Runs the op with the rng state supplied as an input

Ideally, we would like to use torch.compile for these operators. But currently the plan is to introduce these operators at the partitioner level, obviating the need to support them fully through the torch.compile stack. To ensure that we have good enough debugging with minifiers, we have ensure that they work with make_fx. In future, we can move on torch.compile.

Pull Request resolved: https://github.com/pytorch/pytorch/pull/102934
Approved by: https://github.com/jansel, https://github.com/zou3519
This PR just contains some mild gyrations necessary to appease mypy.
However, it is not complete; there are a number of legitimate bugs
and mistyping that I need to work out before I can actually turn this
on.

Signed-off-by: Edward Z. Yang <ezyang@meta.com>

Pull Request resolved: https://github.com/pytorch/pytorch/pull/100712
Approved by: https://github.com/ngimel
Added helper functions to match nodes in the graph that are decomposed from their source (leaf modules, or functional ops), as a result of dynamo tracing.

`get_source_partitions(graph: torch.fx.Graph, wanted_sources: List[Any]) -> Dict[Any, SourcePartition]`

Args:
* graph: The graph we want to partition
* wanted_sources: List of sources of nodes that were decomposed from this source. This can be a function (ex. torch.nn.functional.linear) or a leaf module type (ex. torch.nn.Linear)

Returns:
* Dictionary mapping sources (ex. torch.nn.modules.linear.Linear) to a list of SourcePartitions that correspond to the list of nodes that were flattened from a module of that type.

```
@dataclass
class SourcePartition():
    # Nodes in a particular partition
    nodes: List[Node]
    # Module type
    module_type: Type
    # Nodes in the graph that are needed as inputs to the partition
    input_nodes: List[Node] = field(default_factory=list)
    # Nodes in the partition that are being used by nodes outside of the partition
    output_nodes: List[Node] = field(default_factory=list)
    # Parameters that are being used
    params: List[str] = field(default_factory=list)
```

Example:

Original:
```
x -> linear -> linear -> relu -> linear
```
Traced graph:
```
.graph():
    %arg0 : [#users=1] = placeholder[target=arg0]
    %_param_constant0 : [#users=1] = get_attr[target=_param_constant0]
    %t_default : [#users=1] = call_function[target=torch.ops.aten.t.default](args = (%_param_constant0,), kwargs = {})
    %_param_constant1 : [#users=1] = get_attr[target=_param_constant1]
    %addmm_default : [#users=1] = call_function[target=torch.ops.aten.addmm.default](args = (%_param_constant1, %arg0, %t_default), kwargs = {})
    %_param_constant0_1 : [#users=1] = get_attr[target=_param_constant0]
    %t_default_1 : [#users=1] = call_function[target=torch.ops.aten.t.default](args = (%_param_constant0_1,), kwargs = {})
    %_param_constant1_1 : [#users=1] = get_attr[target=_param_constant1]
    %addmm_default_1 : [#users=1] = call_function[target=torch.ops.aten.addmm.default](args = (%_param_constant1_1, %addmm_default, %t_default_1), kwargs = {})
    %relu_default : [#users=1] = call_function[target=torch.ops.aten.relu.default](args = (%addmm_default_1,), kwargs = {})
    %_param_constant2 : [#users=1] = get_attr[target=_param_constant2]
    %t_default_2 : [#users=1] = call_function[target=torch.ops.aten.t.default](args = (%_param_constant2,), kwargs = {})
    %_param_constant3 : [#users=1] = get_attr[target=_param_constant3]
    %addmm_default_2 : [#users=1] = call_function[target=torch.ops.aten.addmm.default](args = (%_param_constant3, %relu_default, %t_default_2), kwargs = {})
    return [addmm_default_2]
```
Result of `get_module_partitions`:
```
{<class 'torch.nn.modules.linear.Linear'>: [
    ModulePartition(nodes=[_param_constant0, t_default, _param_constant1, addmm_default], module_type=<class 'torch.nn.modules.linear.Linear'>, input_nodes=[arg0], output_nodes=[addmm_default], params=["_param_constant0", "_param_constant1"]),
    ModulePartition(nodes=[_param_constant0_1, t_default_1, _param_constant1_1, addmm_default_1], module_type=<class 'torch.nn.modules.linear.Linear'>, input_nodes=[addmm_default], output_nodes=[addmm_default_1], params=["_param_constant0_1", "_param_constant1_1"]),
    ModulePartition(nodes=[_param_constant2, t_default_2, _param_constant3, addmm_default_2], module_type=<class 'torch.nn.modules.linear.Linear'>, input_nodes=[relu_default], output_nodes=[addmm_default_2], params=["_param_constant2", "_param_constant3"])],

 <class 'torch.nn.modules.activation.ReLU'>: [
    ModulePartition(nodes=[relu_default], module_type=<class 'torch.nn.modules.activation.ReLU'>, input_nodes=[addmm_default_1], output_nodes=[relu_default], params=[])]}
```

Also added helper function to check if two module partitions are connected:
`check_subgraphs_connected(subgraph1: SourcePartition, subgraph2: SourcePartition) -> bool`

Pull Request resolved: https://github.com/pytorch/pytorch/pull/98628
Approved by: https://github.com/cccclai
Command to run max autotune baseline:
```
TORCHINDUCTOR_MAX_AUTOTUNE=1 time python benchmarks/dynamo/torchbench.py --backend inductor --amp --performance --only ${MODEL_NAME} --training --batch-size-file $(realpath benchmarks/dynamo/torchbench_models_list.txt)
```

Command to do coordinate descent autotuning:
```
TORCHINDUCTOR_COORDINATE_DESCENT_TUNING=1 TORCHINDUCTOR_CACHE_DIR=/tmp/torchinductor_shunting_coordesc TORCHINDUCTOR_PERSISTENT_REDUCTIONS=0 TORCHINDUCTOR_MAX_AUTOTUNE=1 time python benchmarks/dynamo/torchbench.py --backend inductor --amp --performance --only ${MODEL_NAME} --training --batch-size-file $(realpath benchmarks/dynamo/torchbench_models_list.txt)
```

Explanation of the envvars show up on the command:
```
- TORCHINDUCTOR_COORDINATE_DESCENT_TUNING=1 : enable coordinate descent tuning
- TORCHINDUCTOR_PERSISTENT_REDUCTIONS=0 : disable persistent reduction. Need do this so we can tune RBLOCK for reductions
- TORCHINDUCTOR_MAX_AUTOTUNE=1: enable max autotune
- TORCHINDUCTOR_CACHE_DIR=/tmp/torchinductor_shunting_coordesc : use a separate cache dir for coordinate descent tuning. Optional.
```

Here are my experiments results for around 40 torchbench models: https://docs.google.com/spreadsheets/d/1G7i2whIf8Yu-HhN_WovNxwcE-iFDSAw4x3NK4uL4XhI/edit#gid=0

Some highlights
- We improve 2.2% further upon max-autotune on average (geomean)
- timm_resnest benefits most from coordinate descent tuning. There is 1.07x speedup
- We have descent speedup on transformer models
  - BERT_pytorch:  1.056x
  - timm_vision_transformer: 1.04x
  - hf_Bert: 1.030x
- For resnet models, it looks like we have less gain as model get larger. My guess is larger model spend more time on mm/conv, so our tuning for pointwise/reduction helps less
  - resnet18: 1.021x
  - resnet50: 1.014x
  - resnet152: 1.005x

This kind of coordinate descent autotuning can give us 'upper bound' of the gain we can get for tuning configs for pointwise/reduction. On the other hand, by spot checking, we roughly double the compilation time compared to max-autotune. Next steps can be
- we disable persistent reduction in coordinate descent autotune (it's still enabled in baseline) so we can tune RBLOCK for reduction. We can also try to use autotune to pick persistent reduction or not.
- pick good config without benchmarking (e.g. Natalia mentioned checking register spill)
- try the idea on matmul so we know what's the potential there.

Pull Request resolved: https://github.com/pytorch/pytorch/pull/97203
Approved by: https://github.com/ngimel
Patterns based on https://github.com/pytorch/pytorch/pull/94729 mainly as a forcing function for implementing joint graph replacements.

Up until now, we had two places to do pattern matching
1) Pre-grad has janky infra (graph not normalized or functional), but is
   desirable for many types of passes where you want your change to
   affect grad formulas.
2) Post-grad has good infra, but cant change grad formulas.

This PR adds a third place to do pattern matching: the joint
forward+backwards graph.  The idea is to take the patterns and lower
them to a joint graph and replace both the forwards+backwards before
we partition them.  This allows us to do something similar to pre-grad
transforms, but run after normalization and functionalization.

Note that we don't seem to have kernels for all of these patterns, some get decomposed in the dispatcher.

Pull Request resolved: https://github.com/pytorch/pytorch/pull/97741
Approved by: https://github.com/Chillee
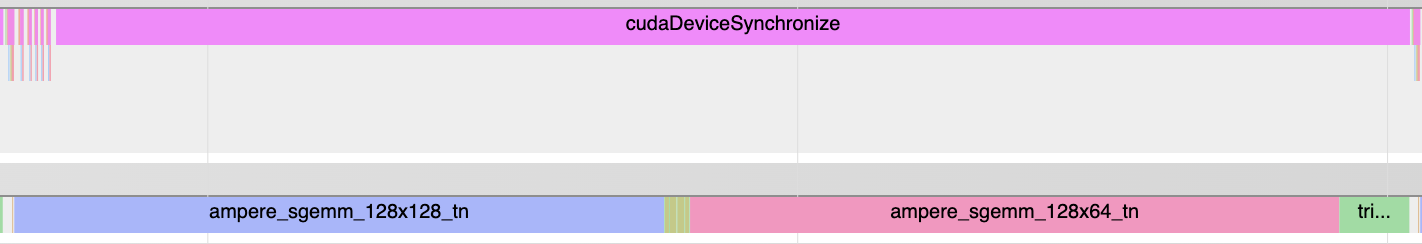
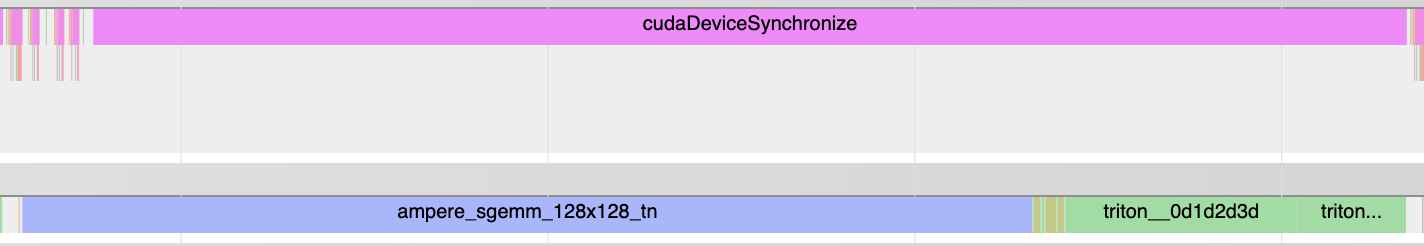
Following metrics should be helpful:
- percent of time GPU is busy
- percent of time various category of kernels (e.g. pointwise/reduction triton kernel) takes
- percent of time each individual kernel takes compared to total wall time of the benchmark

This PR add those.

Example result from hf_Bert infernece graph:

```
  == triton_pointwise category kernels ==
Kernel                            Self CUDA TIME (ms)  Count    Percent
------------------------------  ---------------------  -------  ---------
triton_poi_fused_gelu_6_0d1d                  0.48154  12.0     5.52%
triton_poi_fused_clone_1_0d1d2                0.29011  24.0     3.33%
triton_poi_fused_clone_2_0d1d2                0.17417  12.0     2.00%
triton_poi_fused_clone_4_0d1d2                0.10797  12.0     1.24%
Total                                         1.05379           12.08%

  == triton_persistent_reduction category kernels ==
Kernel                            Self CUDA TIME (ms)  Count    Percent
------------------------------  ---------------------  -------  ---------
triton_per_fused__softmax__to_                0.97188  12.0     11.14%
triton_per_fused_add_native_la                0.37401  24.0     4.29%
triton_per_fused_gelu_native_l                0.02     1.0      0.23%
triton_per_fused_add_embedding                0.01718  1.0      0.20%
Total                                         1.38307           15.86%

  == unknown category kernels ==
Kernel                            Self CUDA TIME (ms)  Count    Percent
------------------------------  ---------------------  -------  ---------
ampere_fp16_s16816gemm_fp16_12                2.24514  24.0     25.74%
ampere_fp16_s16816gemm_fp16_25                1.39796  49.0     16.03%
void cutlass::Kernel<cutlass_8                1.36093  1.0      15.61%
ampere_fp16_s16816gemm_fp16_64                0.74591  12.0     8.55%
ampere_fp16_s16816gemm_fp16_12                0.61989  12.0     7.11%
Memset (Device)                               0.024    12.0     0.28%
void at::native::(anonymous na                0.01543  2.03     0.18%
void at::native::vectorized_el                0.00011  0.03     0.00%
Total                                         6.40937           73.49%

Percent of time when GPU is busy: 101.44%
```

Note: the output shows total time GPU is busy is larger than total wall time. We measure total wall time disabling profiling while measure GPU time enabling profiling, that may distort the measurement a bit? But I assume the effect is not too large assuming the profiler mostly increase CPU time (rather than GPU).

## interesting usages
1. I pick a model that cudagraphs improve perf significantly like densenet121 and run the tool on it's forward graph. It's no surprise that quite a lot of time GPU is idle:
```
(Forward graph) Percent of time when GPU is busy: 32.69%
Total wall time 17.307 ms
```

Its backward graph has less percent of GPU idle time, but it's still high:
```
(Backward graph) Percent of time when GPU is busy: 46.70%
Total wall time 17.422 ms
```

2. I profile a subset of torchbench models and plot a table to show the percent of execution time for pointwise/reduction/persistent_reduction/unknown_category . Since I plan to explore using coordinate descent tuner to improve reduction, those models with high percent of time spending on reduction should be good caididates (e.g. resnet50, mobilenet_v2 ).

NOTE: a same model appears twice. The first rows is for the fwd graph and the second for the bwd graph. We profile different graphs for a model separately.

```
benchmark_name           pointwise_percent    reduction_percent    persistent_reduction_percent    unknown_category_percent    GPU_busy_percent    wall_time_ms
-----------------------  -------------------  -------------------  ------------------------------  --------------------------  ------------------  --------------
resnet18                 19.73%               7.86%                4.81%                           41.25%                      73.65%              2.549ms
resnet18                 18.59%               7.13%                3.35%                           67.35%                      96.41%              3.467ms
resnet50                 29.57%               22.13%               2.07%                           51.68%                      105.46%             6.834ms
resnet50                 26.42%               15.27%               0.94%                           59.68%                      102.31%             13.346ms
vgg16                    26.23%               0.00%                0.00%                           74.20%                      100.43%             18.212ms
vgg16                    15.63%               5.61%                0.10%                           79.42%                      100.75%             33.485ms
BERT_pytorch             28.62%               4.82%                14.88%                          33.32%                      81.64%              7.162ms
BERT_pytorch             14.43%               13.41%               18.19%                          49.24%                      95.27%              10.395ms
densenet121              11.89%               2.14%                3.86%                           16.36%                      34.25%              16.531ms
densenet121              10.37%               2.06%                4.09%                           31.46%                      47.98%              16.934ms
hf_Bert                  23.94%               0.00%                29.88%                          46.09%                      99.90%              7.766ms
hf_Bert                  11.65%               10.54%               20.26%                          61.66%                      104.11%             11.892ms
nvidia_deeprecommender   42.92%               0.00%                0.00%                           56.75%                      99.67%              3.476ms
nvidia_deeprecommender   31.36%               3.44%                0.46%                           65.20%                      100.45%             3.872ms
alexnet                  30.99%               0.00%                0.00%                           69.16%                      100.14%             3.169ms
alexnet                  24.41%               4.83%                0.17%                           71.09%                      100.50%             4.709ms
mobilenet_v2             29.21%               27.79%               2.49%                           44.00%                      103.49%             10.160ms
mobilenet_v2             17.50%               15.05%               1.06%                           69.68%                      103.29%             20.715ms
resnext50_32x4d          18.96%               9.28%                2.31%                           28.79%                      59.33%              5.899ms
resnext50_32x4d          18.48%               11.01%               1.86%                           53.80%                      85.14%              7.167ms
mnasnet1_0               19.07%               14.52%               3.01%                           35.43%                      72.03%              6.028ms
mnasnet1_0               14.17%               12.00%               1.87%                           67.56%                      95.60%              9.225ms
squeezenet1_1            38.56%               0.00%                1.77%                           56.21%                      96.53%              2.221ms
squeezenet1_1            21.26%               7.57%                1.05%                           67.30%                      97.18%              4.942ms
timm_vision_transformer  17.05%               0.00%                18.80%                          65.79%                      101.64%             9.608ms
timm_vision_transformer  9.31%                9.07%                10.32%                          73.25%                      101.96%             16.814ms
```

## how to use
`python {compiled_module_wrapper.py} -p`

Pull Request resolved: https://github.com/pytorch/pytorch/pull/97723
Approved by: https://github.com/jansel
data type: float32
Input size: torch.Size([64, 4, 128, 128])
single socket (32cores):
```
Before: bernoulli 0.001327775239944458 s      dropout 0.0014216173489888509 s
After:  bernoulli 0.0002424612840016683 s     dropout 0.00039757410685221353 s
```

single core:
```
Before: bernoulli 0.04154032731056213 s      dropout 0.04382548745473226 s
After: bernoulli 0.006143261671066284 s      dropout 0.0065830423831939695 s
```

Pull Request resolved: https://github.com/pytorch/pytorch/pull/97002
Approved by: https://github.com/jgong5, https://github.com/jansel
Fixes#96064
When deciding whether to fuse nodes, we match indexing like `c0 + 5 * tmp0`, but `tmp0` in the different nodes can refer to totally different values. Even when `tmp0` is the same (like in the added test) inductor still generates wrongly ordered loads and stores (loads come before stores), so better just disable this fusion altogether. We should fix wrong order also:
```
@pointwise(size_hints=[8], filename=__file__, meta={'signature': {0: '*i64', 1: '*fp32', 2: '*fp32', 3: '*fp32', 4: 'i32'}, 'device': 0, 'constants': {}, 'mutated_arg_names': ['out_ptr0'], 'configs': [instance_descriptor(divisible_by_16=(0, 1, 2, 3), equal_to_1=())]})
@triton.jit
def triton_(in_ptr0, in_ptr1, out_ptr0, out_ptr1, xnumel, XBLOCK : tl.constexpr):
xnumel = 5
xoffset = tl.program_id(0) * XBLOCK
xindex = xoffset + tl.arange(0, XBLOCK)[:]
xmask = xindex < xnumel
x0 = xindex
tmp0_load = tl.load(in_ptr0 + (0))
tmp0 = tl.broadcast_to(tmp0_load, [XBLOCK])
tmp1 = tl.load(in_ptr1 + (x0), xmask)
tmp2 = tl.load(out_ptr0 + (x0 + (5*tmp0)), xmask)
tl.store(out_ptr0 + (x0 + (5*tmp0) + tl.zeros([XBLOCK], tl.int32)), tmp1, xmask)
tl.store(out_ptr1 + (x0 + tl.zeros([XBLOCK], tl.int32)), tmp2, xmask)
```
Note: we are loading from `out_ptr0` here (that shouldn't happen), we are loading from it before storing to it.
After this PR, the kernel above is split in 2.
Pull Request resolved: https://github.com/pytorch/pytorch/pull/96273
Approved by: https://github.com/jansel
This is a follow up for PR #95506 to run all the triton kernels in a compiled module individually as suggested by Horace.
Here are the steps:
1. Run the model as usual with a benchmark script and with TORCHINDUCTOR_BENCHMARK_KERNEL enabled. e.g.
```
TORCHINDUCTOR_BENCHMARK_KERNEL=1 python benchmarks/dynamo/torchbench.py --backend inductor --amp --performance --dashboard --only resnet18 --disable-cudagraphs --training
```
2. From the output we will see 3 lines like
```
Compiled module path: /tmp/torchinductor_shunting/rs/crsuc6zrt3y6lktz33jjqgpkuahya56xj6sentyiz7iv4pjud43j.py
```
That's because we have one graph module for fwd/bwd/optitimizer respectively. Each graph module will have one such output corresponding to the compiled module.
3. We can run the compiled module directly. Without any extra arguments, we just maintain the previous behavior to run the call function -- which just does what the original graph module does but in a more efficient way. But if we add the '-k' argument, we will run benchmark for each individual kernels in the file.
```
python /tmp/torchinductor_shunting/rs/crsuc6zrt3y6lktz33jjqgpkuahya56xj6sentyiz7iv4pjud43j.py -k
```
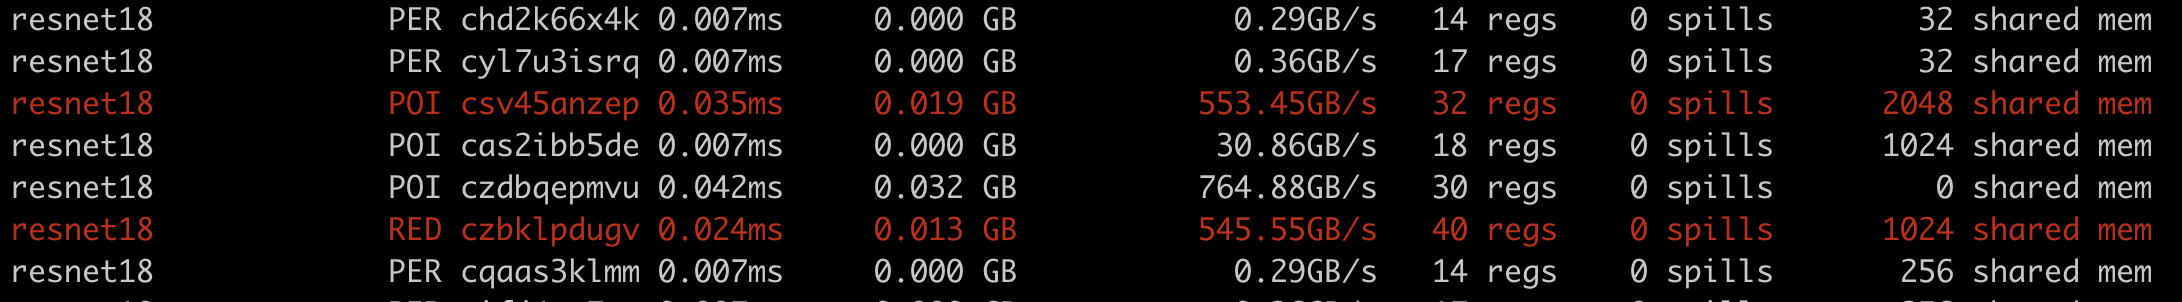
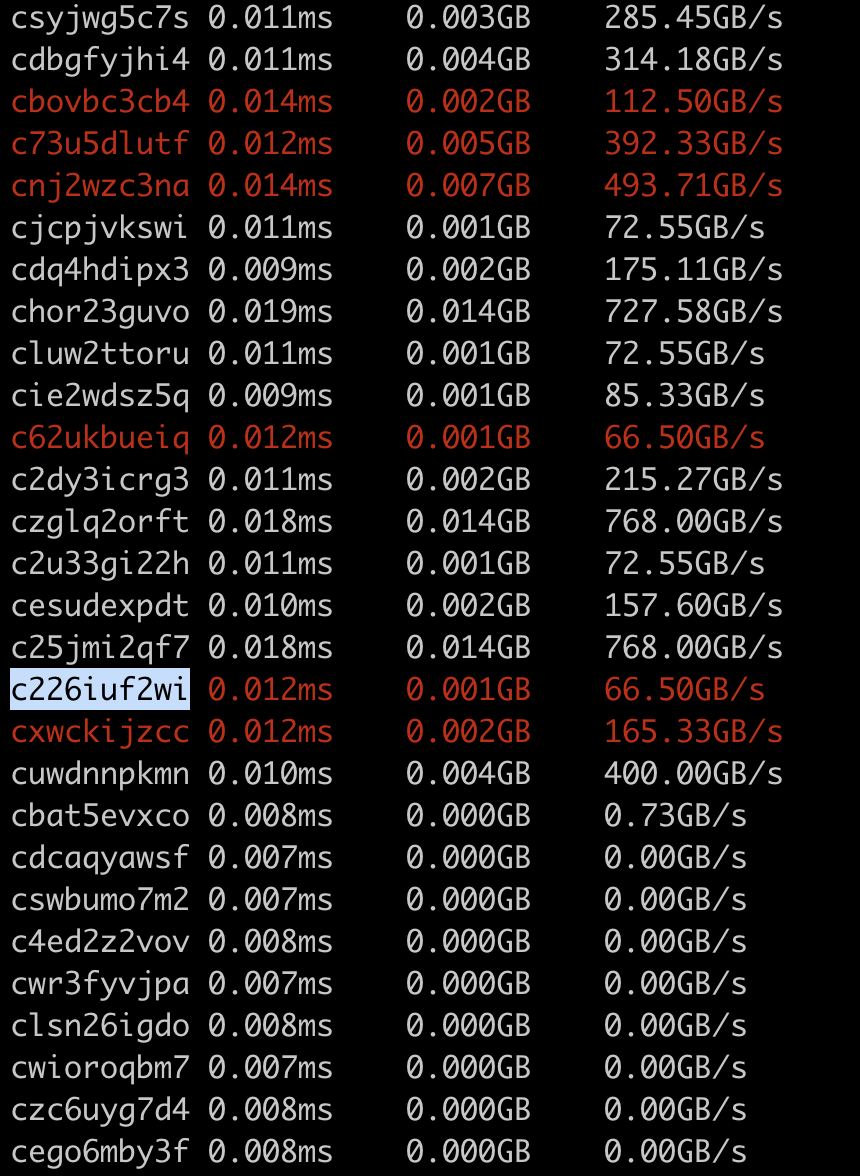
Example output:
<img width="430" alt="Screenshot 2023-03-01 at 4 51 06 PM" src="https://user-images.githubusercontent.com/52589240/222302996-814a85be-472b-463c-9e85-39d2c9d20e1a.png">
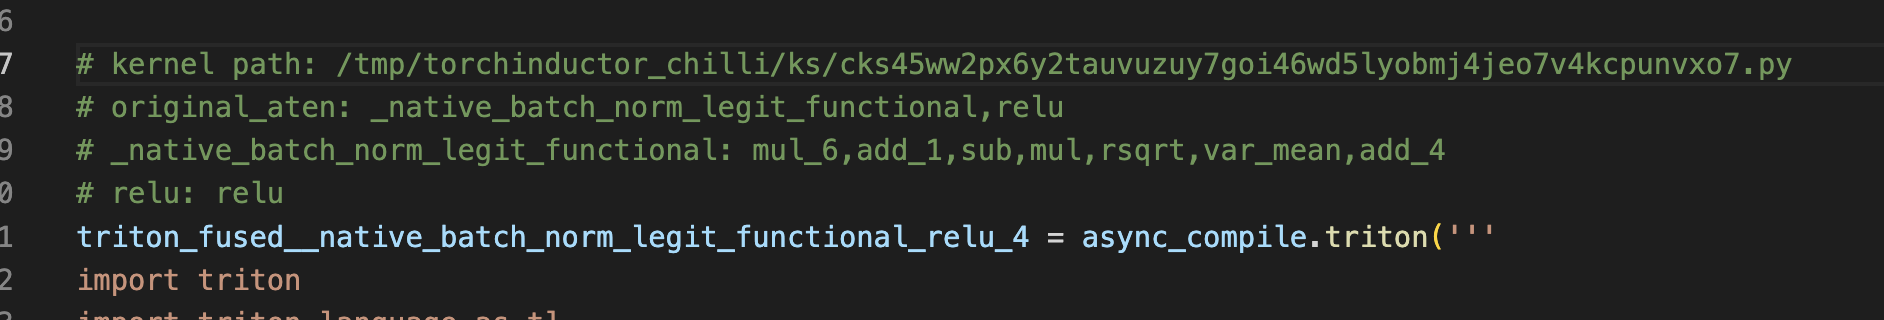
Note: I use the first 10 characters of the hash to identify each kernel since
1. hash is easier to get in the code :)
2. name like `triton__3` only makes sense within a compiled module, but a hash can make sense even without specifying the compiled module (assuming we have enough bytes for the hash)
If we found a triton kernel with hash like c226iuf2wi having poor performance, we can look it up in the original compiled module file. It works since we comment each compiled triton kernel with the full hash.
Pull Request resolved: https://github.com/pytorch/pytorch/pull/95845
Approved by: https://github.com/Chillee