Command to run max autotune baseline:
```
TORCHINDUCTOR_MAX_AUTOTUNE=1 time python benchmarks/dynamo/torchbench.py --backend inductor --amp --performance --only ${MODEL_NAME} --training --batch-size-file $(realpath benchmarks/dynamo/torchbench_models_list.txt)
```

Command to do coordinate descent autotuning:
```
TORCHINDUCTOR_COORDINATE_DESCENT_TUNING=1 TORCHINDUCTOR_CACHE_DIR=/tmp/torchinductor_shunting_coordesc TORCHINDUCTOR_PERSISTENT_REDUCTIONS=0 TORCHINDUCTOR_MAX_AUTOTUNE=1 time python benchmarks/dynamo/torchbench.py --backend inductor --amp --performance --only ${MODEL_NAME} --training --batch-size-file $(realpath benchmarks/dynamo/torchbench_models_list.txt)
```

Explanation of the envvars show up on the command:
```
- TORCHINDUCTOR_COORDINATE_DESCENT_TUNING=1 : enable coordinate descent tuning
- TORCHINDUCTOR_PERSISTENT_REDUCTIONS=0 : disable persistent reduction. Need do this so we can tune RBLOCK for reductions
- TORCHINDUCTOR_MAX_AUTOTUNE=1: enable max autotune
- TORCHINDUCTOR_CACHE_DIR=/tmp/torchinductor_shunting_coordesc : use a separate cache dir for coordinate descent tuning. Optional.
```

Here are my experiments results for around 40 torchbench models: https://docs.google.com/spreadsheets/d/1G7i2whIf8Yu-HhN_WovNxwcE-iFDSAw4x3NK4uL4XhI/edit#gid=0

Some highlights
- We improve 2.2% further upon max-autotune on average (geomean)
- timm_resnest benefits most from coordinate descent tuning. There is 1.07x speedup
- We have descent speedup on transformer models
  - BERT_pytorch:  1.056x
  - timm_vision_transformer: 1.04x
  - hf_Bert: 1.030x
- For resnet models, it looks like we have less gain as model get larger. My guess is larger model spend more time on mm/conv, so our tuning for pointwise/reduction helps less
  - resnet18: 1.021x
  - resnet50: 1.014x
  - resnet152: 1.005x

This kind of coordinate descent autotuning can give us 'upper bound' of the gain we can get for tuning configs for pointwise/reduction. On the other hand, by spot checking, we roughly double the compilation time compared to max-autotune. Next steps can be
- we disable persistent reduction in coordinate descent autotune (it's still enabled in baseline) so we can tune RBLOCK for reduction. We can also try to use autotune to pick persistent reduction or not.
- pick good config without benchmarking (e.g. Natalia mentioned checking register spill)
- try the idea on matmul so we know what's the potential there.

Pull Request resolved: https://github.com/pytorch/pytorch/pull/97203
Approved by: https://github.com/ngimel
Patterns based on https://github.com/pytorch/pytorch/pull/94729 mainly as a forcing function for implementing joint graph replacements.

Up until now, we had two places to do pattern matching
1) Pre-grad has janky infra (graph not normalized or functional), but is
   desirable for many types of passes where you want your change to
   affect grad formulas.
2) Post-grad has good infra, but cant change grad formulas.

This PR adds a third place to do pattern matching: the joint
forward+backwards graph.  The idea is to take the patterns and lower
them to a joint graph and replace both the forwards+backwards before
we partition them.  This allows us to do something similar to pre-grad
transforms, but run after normalization and functionalization.

Note that we don't seem to have kernels for all of these patterns, some get decomposed in the dispatcher.

Pull Request resolved: https://github.com/pytorch/pytorch/pull/97741
Approved by: https://github.com/Chillee
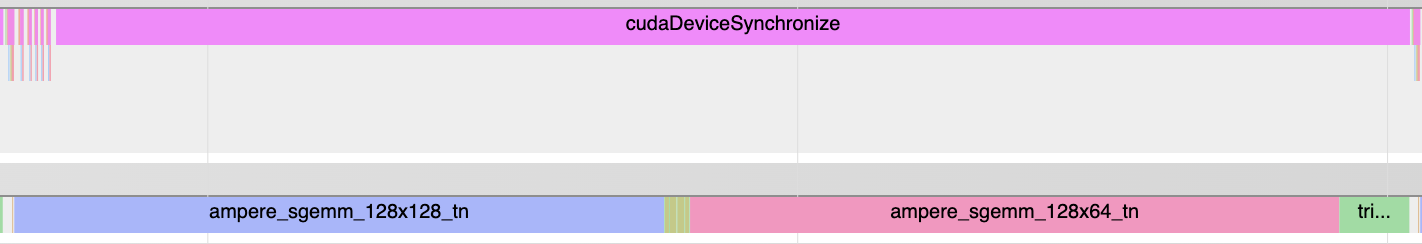
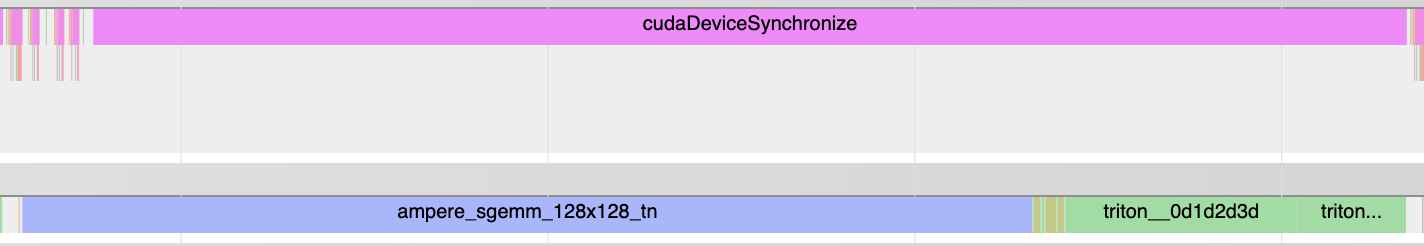
Following metrics should be helpful:
- percent of time GPU is busy
- percent of time various category of kernels (e.g. pointwise/reduction triton kernel) takes
- percent of time each individual kernel takes compared to total wall time of the benchmark

This PR add those.

Example result from hf_Bert infernece graph:

```
  == triton_pointwise category kernels ==
Kernel                            Self CUDA TIME (ms)  Count    Percent
------------------------------  ---------------------  -------  ---------
triton_poi_fused_gelu_6_0d1d                  0.48154  12.0     5.52%
triton_poi_fused_clone_1_0d1d2                0.29011  24.0     3.33%
triton_poi_fused_clone_2_0d1d2                0.17417  12.0     2.00%
triton_poi_fused_clone_4_0d1d2                0.10797  12.0     1.24%
Total                                         1.05379           12.08%

  == triton_persistent_reduction category kernels ==
Kernel                            Self CUDA TIME (ms)  Count    Percent
------------------------------  ---------------------  -------  ---------
triton_per_fused__softmax__to_                0.97188  12.0     11.14%
triton_per_fused_add_native_la                0.37401  24.0     4.29%
triton_per_fused_gelu_native_l                0.02     1.0      0.23%
triton_per_fused_add_embedding                0.01718  1.0      0.20%
Total                                         1.38307           15.86%

  == unknown category kernels ==
Kernel                            Self CUDA TIME (ms)  Count    Percent
------------------------------  ---------------------  -------  ---------
ampere_fp16_s16816gemm_fp16_12                2.24514  24.0     25.74%
ampere_fp16_s16816gemm_fp16_25                1.39796  49.0     16.03%
void cutlass::Kernel<cutlass_8                1.36093  1.0      15.61%
ampere_fp16_s16816gemm_fp16_64                0.74591  12.0     8.55%
ampere_fp16_s16816gemm_fp16_12                0.61989  12.0     7.11%
Memset (Device)                               0.024    12.0     0.28%
void at::native::(anonymous na                0.01543  2.03     0.18%
void at::native::vectorized_el                0.00011  0.03     0.00%
Total                                         6.40937           73.49%

Percent of time when GPU is busy: 101.44%
```

Note: the output shows total time GPU is busy is larger than total wall time. We measure total wall time disabling profiling while measure GPU time enabling profiling, that may distort the measurement a bit? But I assume the effect is not too large assuming the profiler mostly increase CPU time (rather than GPU).

## interesting usages
1. I pick a model that cudagraphs improve perf significantly like densenet121 and run the tool on it's forward graph. It's no surprise that quite a lot of time GPU is idle:
```
(Forward graph) Percent of time when GPU is busy: 32.69%
Total wall time 17.307 ms
```

Its backward graph has less percent of GPU idle time, but it's still high:
```
(Backward graph) Percent of time when GPU is busy: 46.70%
Total wall time 17.422 ms
```

2. I profile a subset of torchbench models and plot a table to show the percent of execution time for pointwise/reduction/persistent_reduction/unknown_category . Since I plan to explore using coordinate descent tuner to improve reduction, those models with high percent of time spending on reduction should be good caididates (e.g. resnet50, mobilenet_v2 ).

NOTE: a same model appears twice. The first rows is for the fwd graph and the second for the bwd graph. We profile different graphs for a model separately.

```
benchmark_name           pointwise_percent    reduction_percent    persistent_reduction_percent    unknown_category_percent    GPU_busy_percent    wall_time_ms
-----------------------  -------------------  -------------------  ------------------------------  --------------------------  ------------------  --------------
resnet18                 19.73%               7.86%                4.81%                           41.25%                      73.65%              2.549ms
resnet18                 18.59%               7.13%                3.35%                           67.35%                      96.41%              3.467ms
resnet50                 29.57%               22.13%               2.07%                           51.68%                      105.46%             6.834ms
resnet50                 26.42%               15.27%               0.94%                           59.68%                      102.31%             13.346ms
vgg16                    26.23%               0.00%                0.00%                           74.20%                      100.43%             18.212ms
vgg16                    15.63%               5.61%                0.10%                           79.42%                      100.75%             33.485ms
BERT_pytorch             28.62%               4.82%                14.88%                          33.32%                      81.64%              7.162ms
BERT_pytorch             14.43%               13.41%               18.19%                          49.24%                      95.27%              10.395ms
densenet121              11.89%               2.14%                3.86%                           16.36%                      34.25%              16.531ms
densenet121              10.37%               2.06%                4.09%                           31.46%                      47.98%              16.934ms
hf_Bert                  23.94%               0.00%                29.88%                          46.09%                      99.90%              7.766ms
hf_Bert                  11.65%               10.54%               20.26%                          61.66%                      104.11%             11.892ms
nvidia_deeprecommender   42.92%               0.00%                0.00%                           56.75%                      99.67%              3.476ms
nvidia_deeprecommender   31.36%               3.44%                0.46%                           65.20%                      100.45%             3.872ms
alexnet                  30.99%               0.00%                0.00%                           69.16%                      100.14%             3.169ms
alexnet                  24.41%               4.83%                0.17%                           71.09%                      100.50%             4.709ms
mobilenet_v2             29.21%               27.79%               2.49%                           44.00%                      103.49%             10.160ms
mobilenet_v2             17.50%               15.05%               1.06%                           69.68%                      103.29%             20.715ms
resnext50_32x4d          18.96%               9.28%                2.31%                           28.79%                      59.33%              5.899ms
resnext50_32x4d          18.48%               11.01%               1.86%                           53.80%                      85.14%              7.167ms
mnasnet1_0               19.07%               14.52%               3.01%                           35.43%                      72.03%              6.028ms
mnasnet1_0               14.17%               12.00%               1.87%                           67.56%                      95.60%              9.225ms
squeezenet1_1            38.56%               0.00%                1.77%                           56.21%                      96.53%              2.221ms
squeezenet1_1            21.26%               7.57%                1.05%                           67.30%                      97.18%              4.942ms
timm_vision_transformer  17.05%               0.00%                18.80%                          65.79%                      101.64%             9.608ms
timm_vision_transformer  9.31%                9.07%                10.32%                          73.25%                      101.96%             16.814ms
```

## how to use
`python {compiled_module_wrapper.py} -p`

Pull Request resolved: https://github.com/pytorch/pytorch/pull/97723
Approved by: https://github.com/jansel
data type: float32
Input size: torch.Size([64, 4, 128, 128])
single socket (32cores):
```
Before: bernoulli 0.001327775239944458 s      dropout 0.0014216173489888509 s
After:  bernoulli 0.0002424612840016683 s     dropout 0.00039757410685221353 s
```

single core:
```
Before: bernoulli 0.04154032731056213 s      dropout 0.04382548745473226 s
After: bernoulli 0.006143261671066284 s      dropout 0.0065830423831939695 s
```

Pull Request resolved: https://github.com/pytorch/pytorch/pull/97002
Approved by: https://github.com/jgong5, https://github.com/jansel
Fixes#96064
When deciding whether to fuse nodes, we match indexing like `c0 + 5 * tmp0`, but `tmp0` in the different nodes can refer to totally different values. Even when `tmp0` is the same (like in the added test) inductor still generates wrongly ordered loads and stores (loads come before stores), so better just disable this fusion altogether. We should fix wrong order also:
```
@pointwise(size_hints=[8], filename=__file__, meta={'signature': {0: '*i64', 1: '*fp32', 2: '*fp32', 3: '*fp32', 4: 'i32'}, 'device': 0, 'constants': {}, 'mutated_arg_names': ['out_ptr0'], 'configs': [instance_descriptor(divisible_by_16=(0, 1, 2, 3), equal_to_1=())]})
@triton.jit
def triton_(in_ptr0, in_ptr1, out_ptr0, out_ptr1, xnumel, XBLOCK : tl.constexpr):
xnumel = 5
xoffset = tl.program_id(0) * XBLOCK
xindex = xoffset + tl.arange(0, XBLOCK)[:]
xmask = xindex < xnumel
x0 = xindex
tmp0_load = tl.load(in_ptr0 + (0))
tmp0 = tl.broadcast_to(tmp0_load, [XBLOCK])
tmp1 = tl.load(in_ptr1 + (x0), xmask)
tmp2 = tl.load(out_ptr0 + (x0 + (5*tmp0)), xmask)
tl.store(out_ptr0 + (x0 + (5*tmp0) + tl.zeros([XBLOCK], tl.int32)), tmp1, xmask)
tl.store(out_ptr1 + (x0 + tl.zeros([XBLOCK], tl.int32)), tmp2, xmask)
```
Note: we are loading from `out_ptr0` here (that shouldn't happen), we are loading from it before storing to it.
After this PR, the kernel above is split in 2.
Pull Request resolved: https://github.com/pytorch/pytorch/pull/96273
Approved by: https://github.com/jansel
This is a follow up for PR #95506 to run all the triton kernels in a compiled module individually as suggested by Horace.
Here are the steps:
1. Run the model as usual with a benchmark script and with TORCHINDUCTOR_BENCHMARK_KERNEL enabled. e.g.
```
TORCHINDUCTOR_BENCHMARK_KERNEL=1 python benchmarks/dynamo/torchbench.py --backend inductor --amp --performance --dashboard --only resnet18 --disable-cudagraphs --training
```
2. From the output we will see 3 lines like
```
Compiled module path: /tmp/torchinductor_shunting/rs/crsuc6zrt3y6lktz33jjqgpkuahya56xj6sentyiz7iv4pjud43j.py
```
That's because we have one graph module for fwd/bwd/optitimizer respectively. Each graph module will have one such output corresponding to the compiled module.
3. We can run the compiled module directly. Without any extra arguments, we just maintain the previous behavior to run the call function -- which just does what the original graph module does but in a more efficient way. But if we add the '-k' argument, we will run benchmark for each individual kernels in the file.
```
python /tmp/torchinductor_shunting/rs/crsuc6zrt3y6lktz33jjqgpkuahya56xj6sentyiz7iv4pjud43j.py -k
```
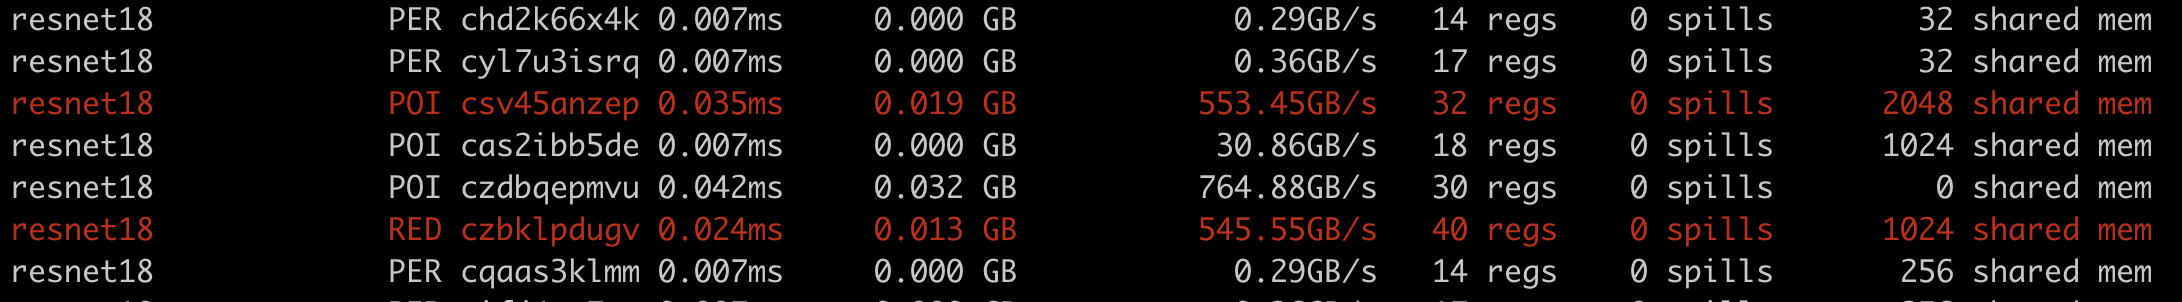
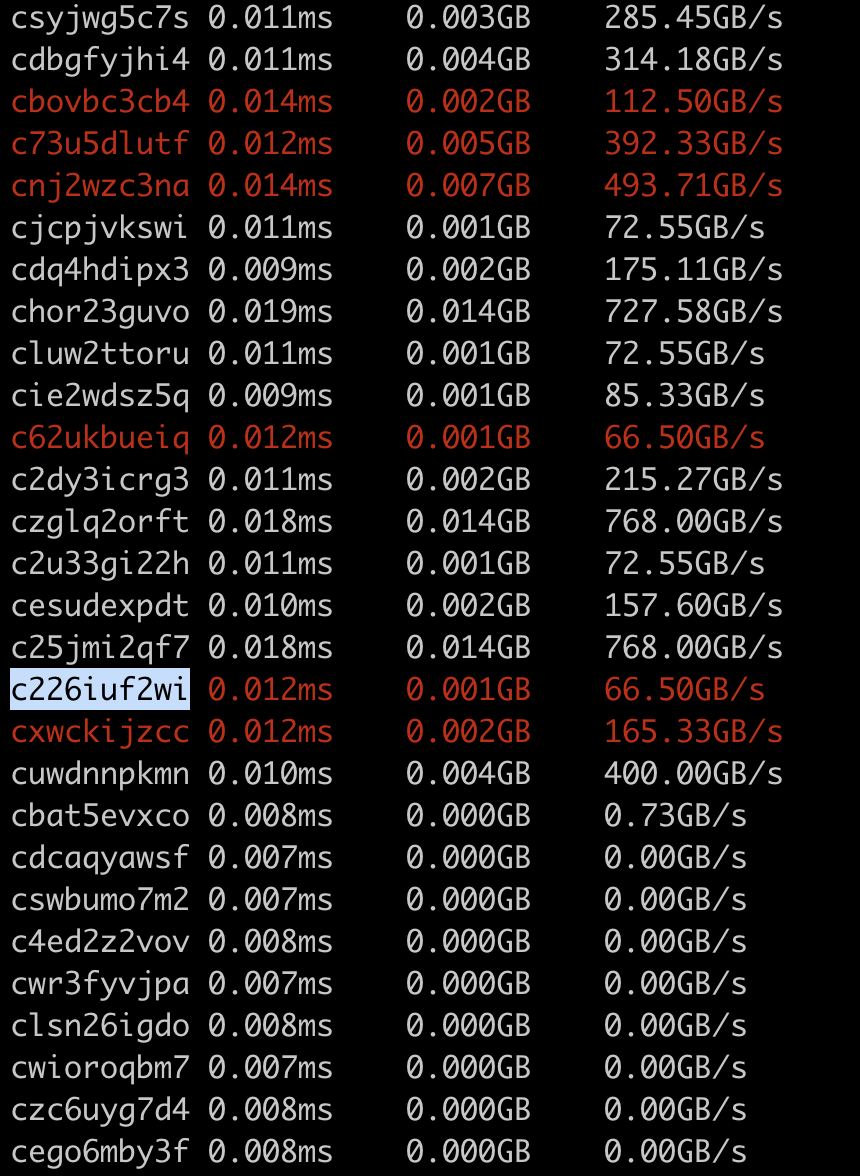
Example output:
<img width="430" alt="Screenshot 2023-03-01 at 4 51 06 PM" src="https://user-images.githubusercontent.com/52589240/222302996-814a85be-472b-463c-9e85-39d2c9d20e1a.png">
Note: I use the first 10 characters of the hash to identify each kernel since
1. hash is easier to get in the code :)
2. name like `triton__3` only makes sense within a compiled module, but a hash can make sense even without specifying the compiled module (assuming we have enough bytes for the hash)
If we found a triton kernel with hash like c226iuf2wi having poor performance, we can look it up in the original compiled module file. It works since we comment each compiled triton kernel with the full hash.
Pull Request resolved: https://github.com/pytorch/pytorch/pull/95845
Approved by: https://github.com/Chillee
OK, so this PR used to be about reducing the number of constants we specialize on, but it turns out that unspecialization was ~essentially never used (because we still constant specialized way too aggressively) and I ended up having to fix a bunch of issues to actually get tests to pass. So this PR is now "make int unspecialization actually work". As part of this, I have to turn off unspecialization by default, as there are still latent bugs in inductor.

The general strategy is that an unspecialized int is represented as a SymInt. Representing it as a 0d tensor (which is what the code used to do) is untenable: (1) we often need unspecialized ints to participate in size computations, but we have no way of propagating sympy expressions through tensor compute, and (2) a lot of APIs work when passed SymInt, but not when passed a Tensor. However, I continue to represent Numpy scalars as Tensors, as they are rarely used for size computation and they have an explicit dtype, so they are more accurately modeled as 0d tensors.

* I folded in the changes from https://github.com/pytorch/pytorch/pull/95099 as I cannot represent unspecialized ints as SymInts without also turning on dynamic shapes. This also eliminates the necessity for test_unspec.py, as toggling specialization without dynamic shapes doesn't do anything. As dynamic shapes defaults to unspecializing, I just deleted this entirely; for the specialization case, I rely on regular static shape tests to catch it. (Hypothetically, we could also rerun all the tests with dynamic shapes, but WITH int/float specialization, but this seems... not that useful? I mean, I guess export wants it, but I'd kind of like our Source heuristic to improve enough that export doesn't have to toggle this either.)
* Only 0/1 integers get specialized by default now
* A hodgepodge of fixes. I'll comment on the PR about them.

Fixes https://github.com/pytorch/pytorch/issues/95469

Signed-off-by: Edward Z. Yang <ezyang@meta.com>

Pull Request resolved: https://github.com/pytorch/pytorch/pull/95621
Approved by: https://github.com/jansel, https://github.com/Chillee
A PR to generate benchmark code for individual triton kernels. We can explore improving autotuning with the saved compiled kernel directly. This potentially can speedup our iteration and separate the concern with the upstream components that generate the compiled module.
Since I'm still ramping up on inductor, I'll reflect what I learned here so people can correct me if I'm wrong. In inductor, WrapperCodeGen class is used to generate the compiled module for CUDA (or triton). Here is an example compiled module for a toy model like: `def f(x): return sin(x) + cos(x)` https://gist.github.com/shunting314/c6ed9f571919e3b414166f1696dcc61b . A compiled module contains the following part:
- various triton kernels
- a wrapper (or a method named call . The name is hardcoded) that calls the triton kernels and potentially ATen kernels to efficiently do the same work as the original Fx graph being compiled by inductor
- some utility code that generate random inputs and run the wrapper
The triton kernels in the compiled module are annotated with decorator like pointwise which is used for autotuning.
This PR add a config so enabling it will just trigger the path of the compiled module being printed. It can be controlled from environment variable as well.
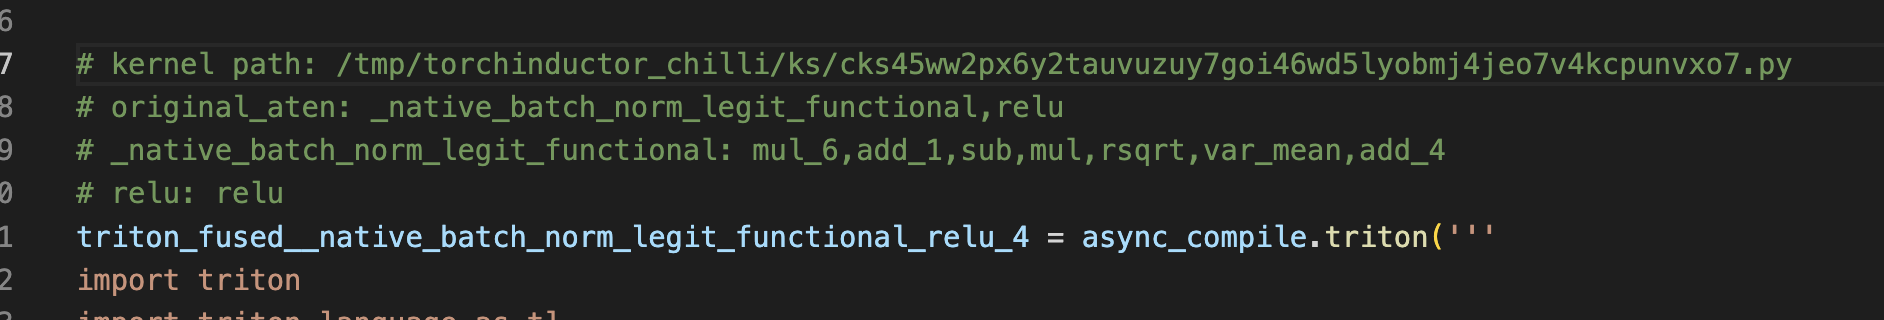
The path to each compiled triton kernel is added as comment in the compiled module. E.g.
```
# kernel path: /tmp/torchinductor_shunting/gn/cgn6x3mqoltu7q77gjnu2elwfupinsvcovqwibc6fhsoiy34tvga.py
triton__0 = async_compile.triton('''
import triton
import triton.language as tl
...
""")
````
Example command:
```
TORCHINDUCTOR_OUTPUT_COMPILED_MODULE_PATH=1 TORCHINDUCTOR_BENCHMARK_KERNEL=1 python benchmarks/dynamo/huggingface.py --backend inductor --amp --performance --training --dashboard --only AlbertForMaskedLM --disable-cudagraphs
```
Pull Request resolved: https://github.com/pytorch/pytorch/pull/95506
Approved by: https://github.com/Chillee
Add _int_mm primitive that binds cuBLAS int8@int8 -> int32 matmul and that translates to Triton based mm templates under max autotune. This is a very useful first step towards better supporting quantization on the GPU. This is a not a user facing API, but an internal primitive.

Pull Request resolved: https://github.com/pytorch/pytorch/pull/94339
Approved by: https://github.com/ngimel, https://github.com/jansel
Summary:
this diff adds logic to handle a global autotuning cache, stored in json format at config.global_cache_path.

what is changing from `DiskCache`:
* `DiskCache` is renamed to `PersistentCache`
* the local cache is now stored as a single file in json format, located at `/tmp/torchinductor_{$USER}/local_cache`. the file contains a dictionary structure like `local_cache[name][inputs][choice]` where `name` is the type of operation, like `addmm`, `inputs` is the repr of the inputs, and `choice` is the hash of a `ChoiceCaller`. the stored value is the benchmark time for that `ChoiceCaller`.
* a global cache is added, initially stored at `fbcode/caffe2/torch/_inductor/global_cache`, with almost identical format as the local cache. since the global cache exists over different machines, there is an additional `dinfo` field, such that `global_cache[dinfo] = local_cache` (at least structure wise, there is no guarantee that the global cache and local cache share the same values). `dinfo` is just a repr of the cuda device properties.
* the autotuner will prioritize the global cache, and return values from there first, before looking in the local cache
* the autotuner will look in both the global cache and the local cache even when `max_autotune=False`, but will still only generate values if `max_autotune=True`.
* the autotuner will log global cache hits and misses to a scuba table (inductor_autotuning_cache) which will be used to update the global cache at regular intervals

Test Plan: D43285472

Differential Revision: D42785435

Pull Request resolved: https://github.com/pytorch/pytorch/pull/94922
Approved by: https://github.com/jansel
Applies the remaining flake8-comprehension fixes and checks. This changes replace all remaining unnecessary generator expressions with list/dict/set comprehensions which are more succinct, performant, and better supported by our torch.jit compiler. It also removes useless generators such as 'set(a for a in b)`, resolving it into just the set call.

Pull Request resolved: https://github.com/pytorch/pytorch/pull/94676
Approved by: https://github.com/ezyang
I applied some flake8 fixes and enabled checking for them in the linter. I also enabled some checks for my previous comprehensions PR.

This is a follow up to #94323 where I enable the flake8 checkers for the fixes I made and fix a few more of them.

Pull Request resolved: https://github.com/pytorch/pytorch/pull/94601
Approved by: https://github.com/ezyang
Historically, we work out `size_hint` by working it out on the fly by doing a substitution on the sympy expression with the `var_to_val` mapping. With this change, we also maintain the hint directly on SymNode (in `expr._hint`) and use it in lieu of Sympy substitution when it is available (mostly guards on SymInt, etc; in particular, in idiomatic Inductor code, we typically manipulate Sympy expressions directly and so do not have a way to conveniently maintain hints.)

While it's possible this will give us modest performance improvements, this is not the point of this PR; the goal is to make it easier to carefully handle unbacked SymInts, where hints are expected not to be available. You can now easily test if a SymInt is backed or not by checking `symint.node.hint is None`.

Signed-off-by: Edward Z. Yang <ezyang@meta.com>

Pull Request resolved: https://github.com/pytorch/pytorch/pull/94201
Approved by: https://github.com/voznesenskym