Actually we would like to not graph break even in the case of Dynamo. But there is a weird-unsolved bug with Kineto + Dynamo when there are distributed jobs that lead to NCCL timeouts. This bug is a rare edege case, but we have not been able to root cause it yet.

But for export, we do not anticipate JIT tracing in distributed job training and therefore this PR is safe for export.

Fixes #ISSUE_NUMBER

Pull Request resolved: https://github.com/pytorch/pytorch/pull/164418
Approved by: https://github.com/StrongerXi, https://github.com/williamwen42
Summary: AI system co-design team requested to add user annotation for FX graph cache key in PyTorch Kineto trace and Execution trace. With this annotation, they can know the FX graph to which the kernels belong.

Test Plan:
buck2 run mode/opt caffe2/test:test_profiler_cuda -- profiler.test_execution_trace.TestExecutionTraceCUDA

Rollback Plan:

Differential Revision: D79019069

Pull Request resolved: https://github.com/pytorch/pytorch/pull/159318
Approved by: https://github.com/sraikund16, https://github.com/jansel
Summary: In D60803317, we added CompileContext (trace_id) information to Kineto traces using caching when a CompileContext exits. As pointed out by some users, this gives innaccurate IDs because we are not getting the context that we is being looked up within the eval_frame. For this reason, we decided to revert that change, and go with an approach that involves getting the trace_id associated with a given CacheEntry. To do this, we add a trace_id to the GuardedCode so that it can be passed onto a CacheEntry. Then, we change the lookup function to return said trace_id alongside the code so that we can pass both into our eval function. Once we get to a Torch-Compiled Region, we can just append the context information to the name of the annotation thus bypassing any need for kwargs.

Test Plan: Added more comprehensive unit test. Saw that all the trace_ids appeared within the graph.

Differential Revision: D63138786

Pull Request resolved: https://github.com/pytorch/pytorch/pull/136460
Approved by: https://github.com/ezyang
Summary:
We want to add compile IDs and frames to each Torch-Compiled Region in order to help users cross reference the section they are checking alongside data obtained from tools, such as tlparse.
This diff operates on the assumption that each graph section will enter and exit a CompileContext before it is ran to either compile the graph or look it up in the cache. Based on this assuption, we can save the value of the graph section from the exited CompileContext in eval_frame.c using a Python C API. After this, we can create a new interface in cpp shim to wrap around the record_function in order to pass in the new keyword argument for "context".

Test Plan:
Enhance test_profiler_dynamo_compiled_region to look for kwinputs as well as a name to see that the context is now labeled. Also changed test to run graph with more contexts so that we test a wider range of profiling.

Differential Revision: D60803317

Pull Request resolved: https://github.com/pytorch/pytorch/pull/132765
Approved by: https://github.com/anijain2305
**Motivation**: We already have a `CompiledFunction` event that comes from the autograd.Function added by aot_autograd. However, this doesn't appear during inference, or if none of the inputs to a graph require grad. It also doesn't appear if your backend doesn't use aot_autograd.

This adds a profiler event that will always appear.

<img width="615" alt="Screenshot 2023-09-01 at 4 46 28 PM" src="https://github.com/pytorch/pytorch/assets/5067123/fed90ca9-a8e7-458c-80eb-b4160de55218">

Perf - increase in latency (with profiler turned off) was within noise when I measured a simple cpu-only torch-compiled function that returned `x.view_as(x)`.

Pull Request resolved: https://github.com/pytorch/pytorch/pull/108462
Approved by: https://github.com/anijain2305
**Background**: "TorchDynamo Cache Lookup" events appear in traces to indicate a dynamo cache lookup; it's useful to check when cache lookups are taking a long time. To add a profiler event, one can use the `torch.profiler.record_function` context manager, or the C++ equivalent. Previously, the python version was used; first, when the profiler was enabled, callbacks for record_function_enter and record_function_exit were registered; then those would be called before and after every cache lookup.

**This PR**: Instead of calling the python bindings for `torch.profiler.record_function`, directly call the C++ implementation. This simplifies a lot of the code for binding C/C++. It also improves performance; previously there was a lot of overhead in the "TorchDynamo Cache Lookup" event, making the event artificially take a long time. After this change the events now appear shorter, because there's less overhead in starting/stopping the event: in other words, the profiler no longer distorts the results as much.

**Performance results**:
I ran using the script below on a cpu-only 1.6GHz machine. I report the median time (from 100 measurements) of a "TorchDynamo Cache Lookup" event before and after this PR. I think it is reasonable to consider the difference to be due to a reduction in overhead.

<details>

<summary>Benchmarking script</summary>

```python
def fn(x, y):
    return (x * y).relu()

a, b = [torch.rand((4, 4), requires_grad=True) for _ in range(2)]

opt_fn = torch.compile(fn)

opt_fn(a, b)
opt_fn(a, b)

with torch.profiler.profile() as prof:
    opt_fn(a, b)
```

</details>

Median before PR: 198-228 us (median of 100, measured 5 times)
Median after PR: 27us

Pull Request resolved: https://github.com/pytorch/pytorch/pull/108436
Approved by: https://github.com/anijain2305, https://github.com/jansel
_enable_dynamo_cache_lookup_profiler used to get turned on when running `__enter__` or `__exit__` with the profiler. But it's possible to turn the profiler on and off without the context manager (e.g. with a schedule and calling `.step()`). Instead, we should put these calls (which are supposed to be executed when the profiler turns on/off) where `_enable_profiler()` and `_disable_profiler()` are called.

This puts `_enable_dynamo_cache_lookup_profiler` and `_set_is_profiler_enabled` into `_run_on_profiler_(start|stop)` and calls that on the 3 places where `_(enable|disable)_profiler` get called.

Differential Revision: [D48619818](https://our.internmc.facebook.com/intern/diff/D48619818)
Pull Request resolved: https://github.com/pytorch/pytorch/pull/107720
Approved by: https://github.com/wconstab
When using torch.profiler.profile(record_shapes=True), the profiler tries to collect `tensor.sizes()` to put this information into the profile trace.

When dynamic shapes is turned on, sometimes tensors will appear that have symbolic sizes. In that case, `tensor.sizes()` can throw an assertion. This PR checks to see if tensor has symbolic shapes, and doesn't collect shape info in that case.

Differential Revision: [D47082414](https://our.internmc.facebook.com/intern/diff/D47082414)
Pull Request resolved: https://github.com/pytorch/pytorch/pull/104320
Approved by: https://github.com/aaronenyeshi
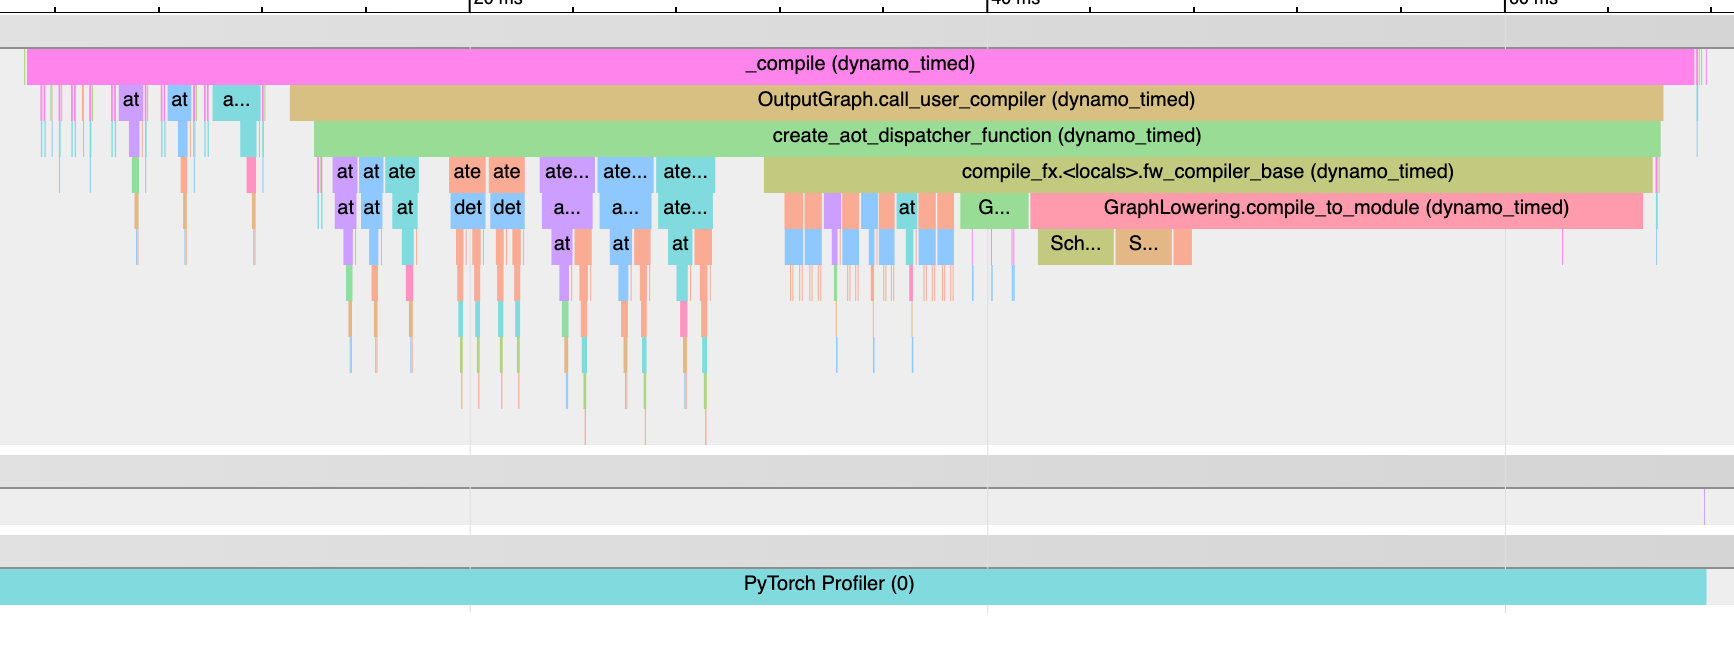
**Summary**: profiler.record_function inserts an event into the chrome trace generated by the pytorch profiler. This PR adds record_function everywhere that @dynamo_timed is annotated.

dynamo_timed and the CLI viewer torch._dynamo.utils.compile_times() are already useful on their own; but for identifying _when_ these get called, it's nice to be able to view in the profiler chrome trace.

Why not just turn on python stack traces in the profiler to get this information? Dynamo compilation is implemented in python and therefore produces a huge amount of events when it records compilation steps. The resulting trace files are often too large to load in chrome://tracing, and they take a long time to generate. Additionally, the stack traces are deep enough that they are often hard to read. This approach produces much more readable traces with lower overhead.

**Tests**:
- Added in test/dynamo/test_profiler.py. Verified in https://github.com/pytorch/pytorch/actions/runs/4559322864/jobs/8043307798?pr=96495 that the tests are actually running.
- Performance run with `ciflow/inductor-perf-compare` shows no noticeable change in compilation time or speedup numbers. Geomean speedup changes from 1.275 -> 1.277. Geomean compilation times change from 54.2s -> 53.8s. That's likely just due to noise. All individual benchmark numbers regressed by no more than 5% between the two runs; and we see improvements of around the same magnitude, suggesting this is, again, just noise. For meta employees, you can see the results in a google sheets here: https://docs.google.com/spreadsheets/d/1Ki69XvcgxcA3ZnqC5n_jav5KiD4u7Wojlad3VTnIdlk/edit?usp=sharing

**Example**:

Run this:

```python
import torch

def gn(x):
    return x.sin().cos()

def fn(x, y):
    return x.sin() * y.cos()

x, y = [torch.rand((2, 2), device='cuda') for _ in range(2)]

# just to clear out any lazy initialization
with torch.profiler.profile() as prof:
    torch.compile(gn)(x)

with torch.profiler.profile() as prof:
    torch.compile(fn)(x, y)

prof.export_chrome_trace("./dynamo_timed_profile.json")
```

and we can see that the resulting trace shows important dynamo steps, even when python tracing is turned off.

<img width="867" alt="Screenshot 2023-03-29 at 7 26 15 PM" src="https://user-images.githubusercontent.com/5067123/228712263-8ae67ab9-1a52-4765-a9c2-7c5cf0abe2f5.png">

Pull Request resolved: https://github.com/pytorch/pytorch/pull/96495
Approved by: https://github.com/ngimel, https://github.com/mlazos